|
Download Data (XLS File) |
|
||||||||
|
||||||||
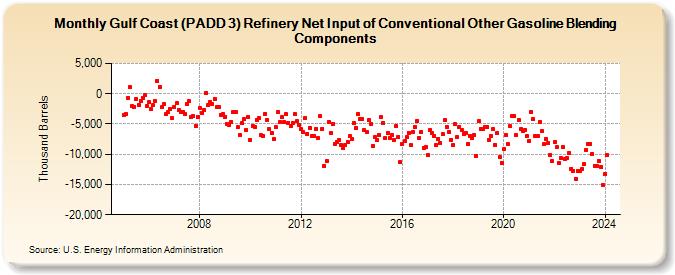
| Gulf Coast (PADD 3) Refinery Net Input of Conventional Other Gasoline Blending Components (Thousand Barrels) | ||||||||
| Year | Jan | Feb | Mar | Apr | May | Jun | Jul | Aug | Sep | Oct | Nov | Dec |
|---|---|---|---|---|---|---|---|---|---|---|---|---|
| 2005 | -3,491 | -3,347 | -680 | 1,046 | -2,033 | -2,170 | -840 | -1,851 | -1,199 | -655 | -231 | -2,023 |
| 2006 | -1,366 | -2,561 | -1,920 | -1,194 | 2,182 | 1,106 | -2,271 | -1,765 | -3,403 | -2,976 | -2,561 | -4,085 |
| 2007 | -2,140 | -1,578 | -2,608 | -3,076 | -2,947 | -3,408 | -1,711 | -1,264 | -3,789 | -3,738 | -5,346 | -3,772 |
| 2008 | -2,409 | -3,104 | -2,700 | 100 | -1,930 | -1,396 | -1,732 | -900 | -2,207 | -2,196 | -3,475 | -3,423 |
| 2009 | -3,789 | -5,017 | -5,182 | -4,636 | -3,097 | -3,096 | -5,573 | -6,849 | -4,844 | -4,255 | -5,974 | -3,886 |
| 2010 | -7,570 | -5,276 | -5,474 | -4,269 | -4,015 | -6,831 | -6,954 | -3,351 | -4,277 | -5,862 | -6,456 | -7,506 |
| 2011 | -5,575 | -2,984 | -4,708 | -3,924 | -4,703 | -3,398 | -4,758 | -5,288 | -4,792 | -3,402 | -4,585 | -5,161 |
| 2012 | -5,845 | -6,395 | -4,014 | -6,605 | -5,609 | -7,056 | -6,923 | -5,784 | -7,337 | -3,755 | -5,774 | -11,870 |
| 2013 | -11,196 | -4,698 | -6,498 | -4,939 | -8,304 | -7,937 | -7,624 | -8,533 | -8,972 | -8,443 | -8,029 | -7,007 |
| 2014 | -7,545 | -4,899 | -5,633 | -3,378 | -4,147 | -4,096 | -6,069 | -6,283 | -4,397 | -5,064 | -8,591 | -7,189 |
| 2015 | -7,618 | -6,746 | -3,910 | -4,838 | -7,369 | -6,467 | -7,349 | -6,861 | -7,586 | -5,374 | -7,135 | -11,320 |
| 2016 | -8,383 | -7,857 | -7,196 | -6,430 | -8,528 | -6,300 | -5,512 | -4,460 | -7,351 | -6,339 | -8,920 | -8,826 |
| 2017 | -10,118 | -5,989 | -6,467 | -6,954 | -8,519 | -7,428 | -8,175 | -6,717 | -4,399 | -5,424 | -6,279 | -7,591 |
| 2018 | -8,460 | -5,023 | -7,191 | -5,471 | -6,024 | -6,632 | -6,496 | -8,304 | -6,959 | -7,345 | -6,796 | -10,255 |
| 2019 | -4,578 | -5,751 | -5,751 | -5,540 | -5,516 | -7,649 | -6,998 | -5,912 | -8,451 | -6,448 | -10,459 | -11,405 |
| 2020 | -9,207 | -6,854 | -8,348 | -5,404 | -3,690 | -3,671 | -6,867 | -4,368 | -5,892 | -6,107 | -5,926 | -7,014 |
| 2021 | -7,783 | -3,006 | -4,254 | -6,975 | -7,053 | -4,703 | -6,201 | -8,319 | -7,501 | -8,156 | -10,129 | -11,169 |
| 2022 | -8,052 | -8,875 | -11,419 | -10,559 | -8,814 | -10,766 | -10,544 | -9,759 | -12,384 | -12,746 | -14,083 | -12,693 |
| 2023 | -12,791 | -12,418 | -11,630 | -9,303 | -8,285 | -8,282 | -9,894 | -11,890 | -11,871 | -11,090 | -12,065 | -15,108 |
| 2024 | -13,228 | -10,178 | -14,855 | -13,144 | -13,011 | -13,438 | ||||||
| - = No Data Reported; -- = Not Applicable; NA = Not Available; W = Withheld to avoid disclosure of individual company data. |
| Release Date: 8/30/2024 |
| Next Release Date: 9/30/2024 |