|
Download Data (XLS File) |
|
||||||||
|
||||||||
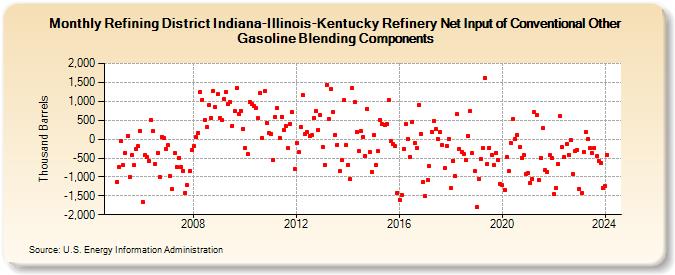
| Refining District Indiana-Illinois-Kentucky Refinery Net Input of Conventional Other Gasoline Blending Components (Thousand Barrels) | ||||||||
| Year | Jan | Feb | Mar | Apr | May | Jun | Jul | Aug | Sep | Oct | Nov | Dec |
|---|---|---|---|---|---|---|---|---|---|---|---|---|
| 2005 | -1,122 | -740 | -56 | -686 | -367 | 90 | -1,006 | -421 | -693 | -274 | -191 | 216 |
| 2006 | -1,660 | -428 | -477 | -587 | 516 | 207 | -652 | -355 | -1,000 | 64 | 19 | -251 |
| 2007 | -165 | -979 | -1,320 | -370 | -737 | -487 | -737 | -833 | -1,419 | -1,225 | -851 | -292 |
| 2008 | -191 | 59 | 173 | 1,243 | 1,044 | 502 | 322 | 897 | 568 | 1,278 | 839 | 1,183 |
| 2009 | 551 | 498 | 1,052 | 1,250 | 919 | 982 | 354 | 731 | 1,352 | 654 | 746 | 276 |
| 2010 | -236 | -405 | 988 | 933 | 866 | 813 | 551 | 1,218 | 28 | 1,262 | 429 | 164 |
| 2011 | 139 | -566 | 597 | 826 | 31 | 592 | 237 | 339 | -246 | 410 | 709 | -789 |
| 2012 | -107 | -348 | 326 | 1,158 | 139 | 180 | 73 | 97 | 553 | 737 | 251 | 635 |
| 2013 | -200 | -674 | 1,432 | 538 | 1,327 | 706 | 119 | -144 | -844 | -553 | 1,023 | -158 |
| 2014 | -675 | -1,057 | 1,351 | 980 | 196 | -317 | 201 | 67 | -437 | 803 | -336 | -883 |
| 2015 | 102 | -679 | -325 | 516 | 399 | 363 | 393 | 1,034 | -58 | -132 | -195 | -1,418 |
| 2016 | -1,601 | -1,475 | -251 | 398 | -8 | -464 | 463 | -99 | -230 | 897 | 141 | -1,129 |
| 2017 | -1,513 | -1,086 | -720 | 194 | 481 | 265 | -2 | 182 | -165 | -774 | -174 | 11 |
| 2018 | -1,301 | -570 | -984 | 655 | -261 | -338 | -381 | -545 | 95 | 730 | -370 | -847 |
| 2019 | -1,806 | -1,044 | -532 | -245 | 1,620 | -658 | -224 | -428 | -696 | -358 | -550 | -1,178 |
| 2020 | -1,222 | -1,343 | -470 | -853 | -115 | 536 | 10 | 120 | -211 | -493 | -422 | -916 |
| 2021 | -895 | -1,149 | -1,045 | 704 | 629 | -1,087 | -492 | 299 | -821 | -859 | -433 | -502 |
| 2022 | -1,459 | -1,295 | -660 | 604 | -217 | -480 | -131 | -414 | -27 | -936 | -314 | -286 |
| 2023 | -1,319 | -1,430 | -341 | 177 | 1 | -245 | -370 | -236 | -460 | -567 | -620 | -1,295 |
| 2024 | -1,249 | -413 | -475 | 540 | -121 | -643 | ||||||
| - = No Data Reported; -- = Not Applicable; NA = Not Available; W = Withheld to avoid disclosure of individual company data. |
| Release Date: 8/30/2024 |
| Next Release Date: 9/30/2024 |