|
Download Data (XLS File) |
|
||||||||
|
||||||||
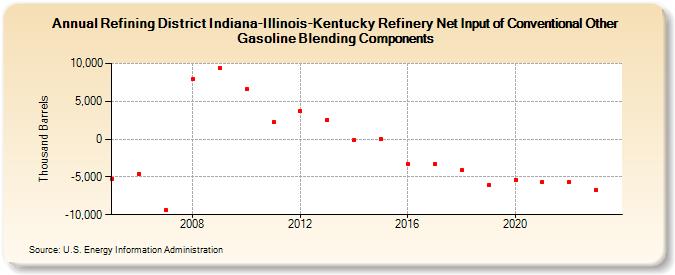
| Refining District Indiana-Illinois-Kentucky Refinery Net Input of Conventional Other Gasoline Blending Components (Thousand Barrels) | ||||||||
| Decade | Year-0 | Year-1 | Year-2 | Year-3 | Year-4 | Year-5 | Year-6 | Year-7 | Year-8 | Year-9 |
|---|---|---|---|---|---|---|---|---|---|---|
| 2000's | -5,250 | -4,604 | -9,415 | 7,917 | 9,365 | |||||
| 2010's | 6,611 | 2,279 | 3,694 | 2,572 | -107 | 0 | -3,358 | -3,301 | -4,117 | -6,099 |
| 2020's | -5,379 | -5,651 | -5,615 | -6,705 |
| - = No Data Reported; -- = Not Applicable; NA = Not Available; W = Withheld to avoid disclosure of individual company data. |
| Release Date: 3/29/2024 |
| Next Release Date: 8/30/2024 |