|
Download Data (XLS File) |
|
||||||||
|
||||||||
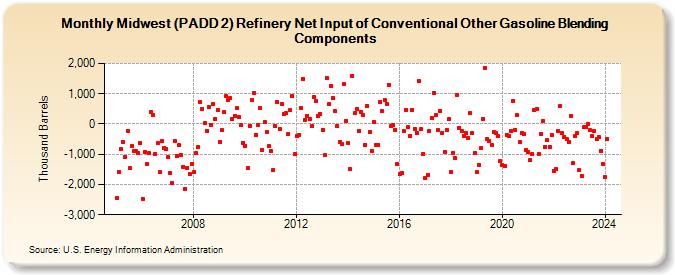
| Midwest (PADD 2) Refinery Net Input of Conventional Other Gasoline Blending Components (Thousand Barrels) | ||||||||
| Year | Jan | Feb | Mar | Apr | May | Jun | Jul | Aug | Sep | Oct | Nov | Dec |
|---|---|---|---|---|---|---|---|---|---|---|---|---|
| 2005 | -2,461 | -1,589 | -830 | -589 | -1,094 | -227 | -1,458 | -737 | -892 | -895 | -958 | -640 |
| 2006 | -2,467 | -931 | -1,331 | -973 | 398 | 281 | -992 | -635 | -1,602 | -572 | -791 | -836 |
| 2007 | -1,102 | -1,627 | -1,966 | -577 | -1,058 | -707 | -1,015 | -1,406 | -2,136 | -1,447 | -1,656 | -1,308 |
| 2008 | -1,603 | -952 | -754 | 710 | 509 | 35 | -222 | 563 | -25 | 664 | 177 | 468 |
| 2009 | -582 | -212 | 394 | 931 | 778 | 866 | 158 | 260 | 527 | 226 | -47 | -618 |
| 2010 | -721 | -1,466 | -55 | 784 | 1,019 | -350 | -19 | 518 | -850 | 65 | -271 | -723 |
| 2011 | -896 | -1,527 | -70 | 724 | -163 | 664 | 314 | 347 | -320 | 451 | 922 | -1,008 |
| 2012 | -408 | -373 | 537 | 1,489 | 142 | 268 | 151 | -70 | 900 | 758 | 278 | 341 |
| 2013 | -190 | -1,038 | 1,527 | 644 | 1,250 | 865 | 424 | -82 | -589 | -673 | 1,312 | 108 |
| 2014 | -641 | -1,498 | 1,587 | 354 | 500 | -234 | 406 | 297 | -679 | 599 | -269 | -881 |
| 2015 | 80 | -684 | -683 | 741 | 428 | 799 | 661 | 1,300 | -70 | -22 | -194 | -1,317 |
| 2016 | -1,668 | -1,625 | -247 | 472 | -107 | -384 | 457 | -150 | -284 | 1,424 | -179 | -989 |
| 2017 | -1,783 | -1,675 | -216 | 183 | 1,034 | 295 | -212 | 434 | -284 | -919 | -212 | 155 |
| 2018 | -1,580 | -968 | -1,130 | 970 | -128 | -244 | -384 | -295 | -463 | 369 | -293 | -946 |
| 2019 | -1,603 | -1,344 | -807 | 176 | 1,859 | -502 | -547 | -697 | -264 | -292 | -410 | -1,237 |
| 2020 | -1,345 | -1,400 | -351 | -410 | -238 | 749 | -192 | 287 | -609 | -288 | -344 | -851 |
| 2021 | -943 | -1,203 | -1,003 | 455 | 498 | -989 | -331 | 100 | -745 | -536 | -746 | -380 |
| 2022 | -1,539 | -1,497 | -243 | 601 | -306 | -417 | -510 | -594 | 251 | -1,292 | -391 | -299 |
| 2023 | -1,533 | -1,720 | -116 | -95 | 2 | -207 | -401 | -234 | -509 | -415 | -881 | -1,336 |
| 2024 | -1,765 | |||||||||||
| - = No Data Reported; -- = Not Applicable; NA = Not Available; W = Withheld to avoid disclosure of individual company data. |
| Release Date: 3/29/2024 |
| Next Release Date: 4/30/2024 |