|
Download Data (XLS File) |
|
||||||||
|
||||||||
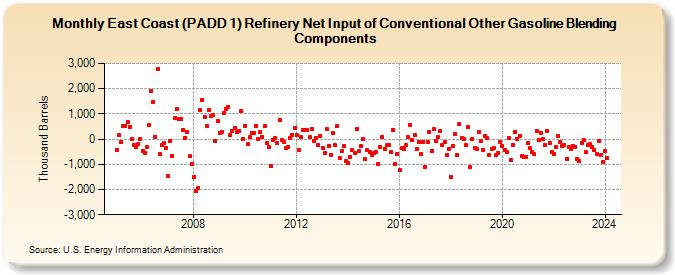
| East Coast (PADD 1) Refinery Net Input of Conventional Other Gasoline Blending Components (Thousand Barrels) | ||||||||
| Year | Jan | Feb | Mar | Apr | May | Jun | Jul | Aug | Sep | Oct | Nov | Dec |
|---|---|---|---|---|---|---|---|---|---|---|---|---|
| 2005 | -441 | 152 | -98 | 525 | 537 | 689 | 483 | -1 | -242 | -321 | -198 | 21 |
| 2006 | -464 | -570 | -308 | 554 | 1,923 | 1,491 | 102 | 2,767 | -586 | -240 | -174 | -349 |
| 2007 | -1,478 | -59 | -690 | 855 | 1,204 | 789 | 789 | 364 | 63 | 274 | -671 | -978 |
| 2008 | -1,503 | -2,050 | -1,957 | 1,161 | 1,568 | 889 | 511 | 1,148 | 916 | 957 | -66 | 733 |
| 2009 | 252 | 263 | 1,048 | 1,204 | 1,276 | 145 | 312 | 450 | 271 | 334 | 1,118 | 23 |
| 2010 | 530 | -202 | 66 | 235 | 254 | 531 | 15 | 280 | 102 | 505 | -149 | -324 |
| 2011 | -1,077 | -53 | 54 | -144 | 767 | -17 | -110 | -336 | -298 | 43 | 179 | 446 |
| 2012 | 165 | -433 | 68 | 367 | 379 | 354 | 70 | 391 | -77 | 48 | -250 | 127 |
| 2013 | -344 | -552 | 395 | -271 | -618 | 224 | -247 | 519 | -757 | -484 | -270 | -877 |
| 2014 | -936 | -702 | -449 | -568 | 386 | -482 | -285 | 19 | -797 | -450 | -509 | -646 |
| 2015 | -558 | -518 | -1,000 | -311 | 70 | -383 | -234 | -228 | -518 | 372 | -987 | -577 |
| 2016 | -1,232 | -366 | -379 | -251 | 69 | 552 | -51 | 171 | -385 | -132 | -589 | -98 |
| 2017 | -1,122 | -113 | 296 | -482 | 382 | -95 | 65 | 331 | -253 | -112 | -625 | -383 |
| 2018 | -1,516 | -257 | 216 | -618 | 601 | 60 | 15 | -231 | 462 | -1,126 | 21 | -341 |
| 2019 | -380 | 265 | -78 | -421 | 137 | 38 | -645 | -411 | -372 | -643 | -542 | -115 |
| 2020 | -266 | -433 | -516 | 49 | -834 | -225 | 299 | 20 | 133 | -668 | -727 | -698 |
| 2021 | -138 | -356 | -521 | -609 | 303 | -19 | 237 | -6 | -243 | 316 | -174 | -523 |
| 2022 | -600 | -311 | 138 | -102 | -260 | -250 | -789 | -294 | -384 | -273 | -299 | -785 |
| 2023 | -867 | -139 | -35 | -528 | -250 | -181 | -309 | -444 | -592 | -74 | -632 | -916 |
| 2024 | -465 | |||||||||||
| - = No Data Reported; -- = Not Applicable; NA = Not Available; W = Withheld to avoid disclosure of individual company data. |
| Release Date: 3/29/2024 |
| Next Release Date: 4/30/2024 |