|
Download Data (XLS File) |
|
||||||||
|
||||||||
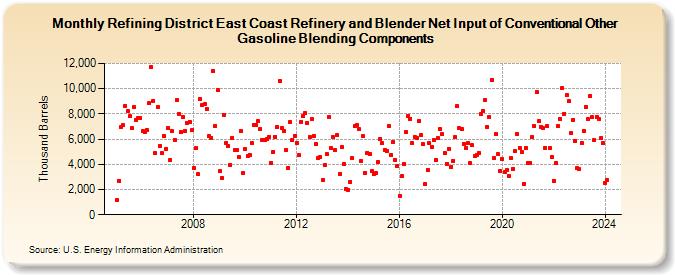
| Refining District East Coast Refinery and Blender Net Input of Conventional Other Gasoline Blending Components (Thousand Barrels) | ||||||||
| Year | Jan | Feb | Mar | Apr | May | Jun | Jul | Aug | Sep | Oct | Nov | Dec |
|---|---|---|---|---|---|---|---|---|---|---|---|---|
| 2005 | 1,134 | 2,701 | 6,951 | 7,084 | 8,653 | 8,247 | 7,824 | 6,857 | 8,524 | 7,493 | 7,644 | 7,688 |
| 2006 | 6,635 | 6,600 | 6,702 | 8,842 | 11,685 | 9,024 | 4,879 | 8,571 | 5,490 | 4,863 | 6,252 | 5,251 |
| 2007 | 6,854 | 4,356 | 6,620 | 5,963 | 9,085 | 8,024 | 6,526 | 7,736 | 6,636 | 7,278 | 7,386 | 6,690 |
| 2008 | 3,737 | 5,299 | 3,210 | 9,164 | 8,742 | 8,782 | 8,412 | 6,212 | 6,112 | 11,391 | 7,044 | 9,882 |
| 2009 | 3,439 | 2,940 | 7,912 | 5,705 | 5,472 | 3,955 | 6,087 | 5,131 | 5,163 | 4,547 | 6,632 | 3,300 |
| 2010 | 5,207 | 4,658 | 4,766 | 5,677 | 7,112 | 7,154 | 7,418 | 6,791 | 5,915 | 5,939 | 6,022 | 6,194 |
| 2011 | 4,140 | 5,011 | 6,172 | 6,974 | 10,619 | 6,894 | 6,614 | 5,149 | 3,728 | 7,356 | 5,955 | 6,263 |
| 2012 | 5,718 | 4,729 | 7,381 | 7,825 | 8,065 | 7,306 | 6,177 | 7,570 | 6,271 | 5,628 | 4,466 | 4,549 |
| 2013 | 2,765 | 3,953 | 4,809 | 7,762 | 5,288 | 6,132 | 5,145 | 6,319 | 3,247 | 5,364 | 4,024 | 2,040 |
| 2014 | 1,998 | 2,632 | 4,464 | 7,035 | 7,089 | 6,787 | 4,273 | 6,240 | 3,330 | 4,921 | 4,814 | 3,433 |
| 2015 | 3,252 | 3,292 | 4,207 | 6,002 | 5,652 | 5,154 | 5,019 | 7,008 | 4,748 | 5,777 | 4,322 | 3,827 |
| 2016 | 1,518 | 3,034 | 4,049 | 6,565 | 7,871 | 7,616 | 5,674 | 6,194 | 6,117 | 7,427 | 6,288 | 5,588 |
| 2017 | 2,433 | 3,578 | 5,688 | 5,387 | 5,951 | 4,355 | 6,060 | 6,801 | 6,406 | 4,898 | 4,058 | 5,243 |
| 2018 | 3,817 | 4,288 | 6,140 | 8,590 | 6,863 | 6,782 | 5,649 | 5,303 | 5,716 | 4,080 | 5,503 | 4,640 |
| 2019 | 4,764 | 4,933 | 7,972 | 8,227 | 9,110 | 6,966 | 7,749 | 10,727 | 4,487 | 6,403 | 4,783 | 3,482 |
| 2020 | 4,393 | 3,418 | 3,509 | 3,080 | 4,486 | 3,659 | 5,037 | 6,367 | 5,324 | 5,009 | 2,470 | 5,323 |
| 2021 | 4,116 | 4,122 | 6,181 | 7,045 | 9,743 | 7,412 | 6,998 | 6,846 | 5,319 | 7,012 | 5,279 | 4,562 |
| 2022 | 2,699 | 4,085 | 7,065 | 7,607 | 10,067 | 8,031 | 9,491 | 9,001 | 6,458 | 7,555 | 5,859 | 3,677 |
| 2023 | 3,622 | 5,698 | 6,629 | 8,585 | 7,567 | 9,422 | 7,725 | 5,946 | 7,755 | 7,558 | 6,063 | 5,671 |
| 2024 | 2,553 | |||||||||||
| - = No Data Reported; -- = Not Applicable; NA = Not Available; W = Withheld to avoid disclosure of individual company data. |
| Release Date: 3/29/2024 |
| Next Release Date: 4/30/2024 |