|
Download Data (XLS File) |
|
||||||||
|
||||||||
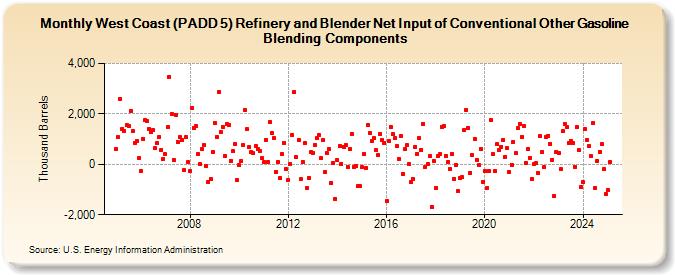
| West Coast (PADD 5) Refinery and Blender Net Input of Conventional Other Gasoline Blending Components (Thousand Barrels) | ||||||||
| Year | Jan | Feb | Mar | Apr | May | Jun | Jul | Aug | Sep | Oct | Nov | Dec |
|---|---|---|---|---|---|---|---|---|---|---|---|---|
| 2005 | 589 | 1,083 | 2,605 | 1,402 | 1,326 | 1,540 | 1,503 | 2,132 | 1,330 | 862 | 936 | 234 |
| 2006 | -261 | 1,015 | 1,740 | 1,735 | 1,403 | 1,272 | 1,354 | 631 | 843 | 1,085 | 586 | 222 |
| 2007 | 391 | 1,469 | 3,469 | 2,000 | 185 | 1,948 | 898 | 1,068 | 981 | -235 | 1,071 | 73 |
| 2008 | -270 | 2,246 | 1,454 | 1,500 | 406 | 7 | 591 | 767 | -65 | -690 | -574 | 480 |
| 2009 | 1,655 | 1,085 | 2,870 | 1,286 | 1,487 | 324 | 1,611 | 1,565 | 145 | 510 | 797 | -640 |
| 2010 | -40 | 138 | 757 | 2,140 | 1,390 | 701 | 480 | 432 | 709 | 600 | 532 | 243 |
| 2011 | 89 | 970 | 109 | 1,681 | 1,234 | 1,050 | -310 | 105 | -534 | 415 | 864 | -196 |
| 2012 | -639 | 10 | 1,155 | 2,874 | 273 | 957 | -600 | 94 | 838 | -923 | -539 | 477 |
| 2013 | 464 | 784 | 1,032 | 1,149 | 242 | 970 | -313 | 432 | 592 | -742 | 51 | -1,372 |
| 2014 | 170 | 731 | 27 | 699 | 775 | -94 | 605 | 1,214 | -111 | -63 | -876 | -866 |
| 2015 | -104 | 414 | -145 | 1,561 | 1,240 | 906 | 1,032 | 572 | 362 | 1,219 | 946 | 863 |
| 2016 | -1,461 | 934 | 1,481 | 1,183 | 1,036 | 715 | 222 | 1,113 | -377 | 605 | 763 | -1 |
| 2017 | -708 | -594 | 702 | 421 | 1,030 | 584 | 1,601 | -97 | 5 | 317 | -1,694 | 139 |
| 2018 | -949 | 324 | 397 | 1,479 | 1,507 | 333 | 100 | -193 | 425 | -566 | -23 | -1,073 |
| 2019 | -541 | -515 | 1,363 | 2,159 | 1,449 | -327 | 355 | 1,021 | 181 | -35 | 607 | -698 |
| 2020 | -247 | -935 | -254 | 1,746 | 389 | -280 | 792 | 552 | 701 | 980 | 292 | 632 |
| 2021 | -300 | -17 | 895 | 435 | 1,424 | 1,609 | 1,100 | 1,538 | 67 | 594 | 269 | -576 |
| 2022 | 9 | 38 | -341 | 1,114 | 500 | -125 | 1,079 | 1,140 | 821 | 178 | -1,264 | 507 |
| 2023 | 440 | -198 | 1,303 | 1,615 | 1,476 | 849 | 938 | 849 | -95 | 1,474 | 556 | -887 |
| 2024 | -713 | |||||||||||
| - = No Data Reported; -- = Not Applicable; NA = Not Available; W = Withheld to avoid disclosure of individual company data. |
| Release Date: 3/29/2024 |
| Next Release Date: 4/30/2024 |