|
Download Data (XLS File) |
|
||||||||
|
||||||||
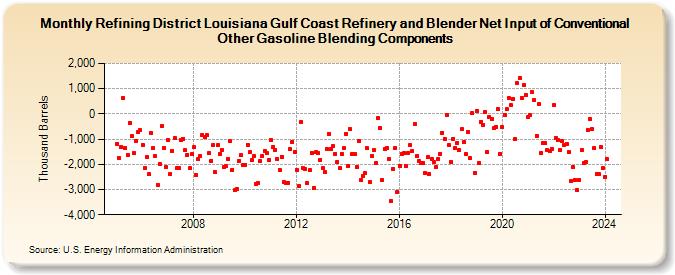
| Refining District Louisiana Gulf Coast Refinery and Blender Net Input of Conventional Other Gasoline Blending Components (Thousand Barrels) | ||||||||
| Year | Jan | Feb | Mar | Apr | May | Jun | Jul | Aug | Sep | Oct | Nov | Dec |
|---|---|---|---|---|---|---|---|---|---|---|---|---|
| 2005 | -1,194 | -1,736 | -1,305 | 646 | -1,348 | -1,619 | -357 | -881 | -1,554 | -1,091 | -734 | -640 |
| 2006 | -1,234 | -2,142 | -1,712 | -2,402 | -769 | -1,356 | -1,684 | -2,811 | -1,980 | -478 | -1,344 | -2,110 |
| 2007 | -1,038 | -2,394 | -1,456 | -965 | -2,155 | -2,149 | -1,029 | -982 | -1,444 | -1,613 | -2,159 | -1,603 |
| 2008 | -1,324 | -2,405 | -1,805 | -1,679 | -844 | -931 | -845 | -1,556 | -1,851 | -1,237 | -2,317 | -1,245 |
| 2009 | -1,586 | -1,428 | -2,108 | -2,087 | -1,783 | -1,093 | -2,214 | -3,027 | -2,979 | -1,851 | -1,642 | -2,017 |
| 2010 | -2,011 | -1,218 | -1,531 | -1,849 | -1,690 | -2,762 | -2,732 | -1,873 | -1,655 | -1,468 | -1,556 | -1,828 |
| 2011 | -1,047 | -1,301 | -1,417 | -1,778 | -2,209 | -1,700 | -2,706 | -2,758 | -2,730 | -1,411 | -1,100 | -1,501 |
| 2012 | -2,219 | -2,844 | -331 | -2,135 | -2,195 | -2,743 | -2,241 | -1,535 | -2,926 | -1,527 | -1,564 | -1,824 |
| 2013 | -2,162 | -2,298 | -1,374 | -782 | -1,398 | -1,288 | -1,579 | -1,889 | -2,166 | -1,578 | -1,370 | -780 |
| 2014 | -2,085 | -602 | -1,598 | -1,606 | -2,098 | -1,078 | -2,628 | -2,469 | -2,364 | -1,369 | -2,707 | -1,682 |
| 2015 | -1,425 | -1,960 | -162 | -550 | -2,631 | -1,404 | -1,343 | -1,770 | -3,454 | -2,185 | -1,358 | -3,080 |
| 2016 | -2,073 | -1,589 | -1,568 | -2,061 | -1,532 | -1,229 | -1,484 | -406 | -1,670 | -1,876 | -1,941 | -1,962 |
| 2017 | -2,359 | -1,730 | -2,370 | -1,781 | -1,901 | -2,109 | -1,780 | -1,581 | -740 | -992 | -30 | -1,227 |
| 2018 | -1,907 | -980 | -1,338 | -1,136 | -1,429 | -619 | -1,109 | -1,596 | -718 | -1,759 | 29 | -2,327 |
| 2019 | 115 | -1,951 | -304 | -424 | 59 | -1,507 | -121 | -189 | -579 | -519 | 191 | -1,575 |
| 2020 | -526 | -32 | 178 | 630 | 338 | 581 | -994 | 1,212 | 1,418 | 633 | 1,144 | 748 |
| 2021 | -108 | -62 | 858 | 550 | -858 | 387 | -1,532 | -1,165 | -1,170 | -1,443 | -1,490 | -1,388 |
| 2022 | 335 | -953 | -1,050 | -1,440 | -1,089 | -1,244 | -1,185 | -1,510 | -2,681 | -2,120 | -2,614 | -3,026 |
| 2023 | -2,626 | -1,433 | -1,963 | -1,902 | -644 | -219 | -619 | -1,348 | -2,383 | -2,396 | -1,304 | -2,133 |
| 2024 | -2,485 | -1,808 | ||||||||||
| - = No Data Reported; -- = Not Applicable; NA = Not Available; W = Withheld to avoid disclosure of individual company data. |
| Release Date: 4/30/2024 |
| Next Release Date: 5/31/2024 |