|
Download Data (XLS File) |
|
||||||||
|
||||||||
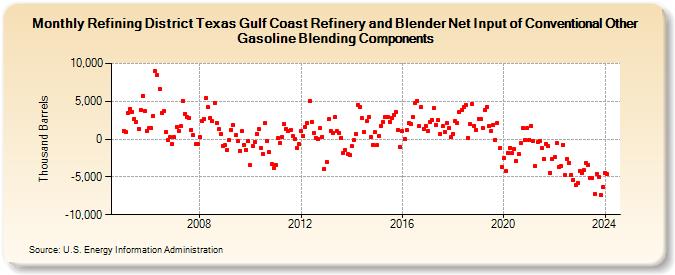
| Refining District Texas Gulf Coast Refinery and Blender Net Input of Conventional Other Gasoline Blending Components (Thousand Barrels) | ||||||||
| Year | Jan | Feb | Mar | Apr | May | Jun | Jul | Aug | Sep | Oct | Nov | Dec |
|---|---|---|---|---|---|---|---|---|---|---|---|---|
| 2005 | 1,108 | 892 | 3,459 | 4,014 | 3,632 | 2,684 | 2,198 | 1,390 | 3,892 | 5,740 | 3,710 | 1,118 |
| 2006 | 1,525 | 1,467 | 3,058 | 8,976 | 8,474 | 6,649 | 3,496 | 3,658 | 961 | -143 | 221 | -600 |
| 2007 | 222 | 1,635 | 1,112 | 1,687 | 5,081 | 3,385 | 2,922 | 2,820 | 1,268 | 507 | -709 | -632 |
| 2008 | 272 | 2,458 | 2,645 | 5,490 | 4,205 | 2,791 | 2,348 | 4,824 | 2,190 | 1,274 | 694 | -898 |
| 2009 | -815 | -1,376 | -118 | 1,214 | 1,816 | 503 | -290 | -1,546 | 1,042 | -740 | -1,404 | -293 |
| 2010 | -3,467 | -950 | -349 | 697 | 1,283 | -1,167 | -1,939 | 2,145 | -188 | -1,759 | -3,356 | -3,872 |
| 2011 | -3,384 | 133 | -570 | 278 | 2,019 | 1,375 | 1,019 | 1,249 | 415 | 45 | -1,157 | -654 |
| 2012 | 1,013 | 449 | 1,640 | 2,154 | 5,068 | 2,268 | 852 | 147 | -46 | 1,414 | 330 | -3,895 |
| 2013 | -3,002 | 2,602 | 1,089 | 851 | 2,920 | 1,034 | 865 | 170 | -1,781 | -1,389 | -2,036 | -2,168 |
| 2014 | -924 | -152 | 647 | 4,530 | 4,223 | 2,740 | 914 | 2,384 | 2,913 | 286 | -745 | 889 |
| 2015 | -838 | 429 | 1,783 | 2,239 | 2,917 | 2,975 | 2,319 | 2,836 | 3,246 | 3,565 | 1,250 | -1,068 |
| 2016 | 1,024 | 52 | 1,194 | 2,115 | 2,008 | 2,918 | 4,797 | 5,104 | 1,742 | 4,206 | 1,395 | 1,745 |
| 2017 | 1,005 | 2,204 | 2,530 | 4,062 | 1,914 | 2,465 | 683 | 1,673 | 978 | 2,126 | 1,507 | 227 |
| 2018 | 688 | 2,371 | 2,125 | 3,550 | 3,874 | 4,213 | 4,538 | 165 | 1,985 | 4,655 | 1,792 | 1,194 |
| 2019 | 2,704 | 2,621 | 1,467 | 3,815 | 4,294 | 1,733 | 1,101 | 1,909 | -94 | 2,137 | -1,236 | -3,657 |
| 2020 | -2,495 | -4,226 | -1,774 | -1,114 | -1,884 | -1,304 | -2,946 | -1,972 | -527 | 1,456 | -134 | 1,430 |
| 2021 | -54 | 1,750 | -309 | -3,585 | -441 | -239 | -1,209 | -2,614 | -596 | -975 | -4,419 | -2,605 |
| 2022 | -2,370 | -576 | -3,732 | -3,572 | -729 | -4,725 | -2,582 | -3,124 | -4,733 | -5,350 | -6,112 | -5,818 |
| 2023 | -4,270 | -4,466 | -4,115 | -3,101 | -3,431 | -5,157 | -5,185 | -7,246 | -4,567 | -4,985 | -7,365 | -6,327 |
| 2024 | -4,450 | -4,681 | -9,816 | -7,067 | -8,298 | -9,353 | ||||||
| - = No Data Reported; -- = Not Applicable; NA = Not Available; W = Withheld to avoid disclosure of individual company data. |
| Release Date: 8/30/2024 |
| Next Release Date: 9/30/2024 |