|
Download Data (XLS File) |
|
||||||||
|
||||||||
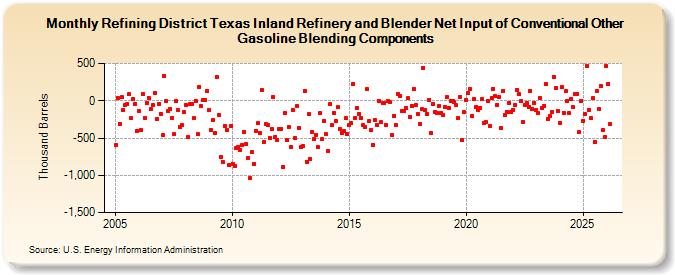
| Refining District Texas Inland Refinery and Blender Net Input of Conventional Other Gasoline Blending Components (Thousand Barrels) | ||||||||
| Year | Jan | Feb | Mar | Apr | May | Jun | Jul | Aug | Sep | Oct | Nov | Dec |
|---|---|---|---|---|---|---|---|---|---|---|---|---|
| 2005 | -592 | 35 | -308 | 44 | -127 | -56 | -43 | 86 | -237 | 23 | -39 | -400 |
| 2006 | -139 | -396 | 93 | -229 | -32 | 38 | -116 | -60 | 102 | -242 | -45 | -172 |
| 2007 | -464 | 338 | -9 | -143 | -111 | -225 | -450 | -10 | -123 | -351 | -329 | -155 |
| 2008 | -59 | -483 | -50 | -37 | -235 | -2 | -452 | 191 | -73 | 16 | 16 | 131 |
| 2009 | -121 | -393 | -252 | -436 | 316 | -188 | -757 | -815 | -334 | -387 | -867 | -344 |
| 2010 | -843 | -869 | -630 | -620 | -662 | -597 | -420 | -578 | -765 | -1,035 | -694 | -844 |
| 2011 | -401 | -305 | -426 | 148 | -555 | -313 | -325 | -501 | -381 | 50 | -480 | -522 |
| 2012 | -374 | -379 | -885 | -169 | -531 | -355 | -615 | -125 | -503 | -74 | -363 | -627 |
| 2013 | -611 | 133 | -817 | -182 | -783 | -421 | -512 | -455 | -621 | -169 | -519 | -273 |
| 2014 | -451 | -676 | -48 | -330 | -164 | -272 | -87 | -377 | -428 | -411 | -238 | -449 |
| 2015 | -320 | -305 | 231 | -234 | -91 | -181 | -226 | -331 | -353 | 156 | -277 | -396 |
| 2016 | -587 | -257 | -325 | 2 | -290 | -32 | -30 | -327 | -2 | -21 | -463 | -202 |
| 2017 | -322 | 97 | 67 | -139 | -142 | -92 | 33 | -218 | -65 | 164 | -60 | -180 |
| 2018 | -312 | -114 | 444 | -118 | -174 | 14 | -436 | -39 | -147 | -162 | -70 | -158 |
| 2019 | -188 | -87 | 48 | -99 | -1 | -7 | -21 | -63 | -232 | 54 | -521 | -154 |
| 2020 | 12 | 101 | 158 | -207 | 27 | -78 | -120 | -91 | 22 | -297 | -279 | 3 |
| 2021 | -340 | 37 | 164 | 60 | -52 | 49 | -366 | 134 | -188 | -153 | -26 | -155 |
| 2022 | -119 | -52 | 145 | 84 | -5 | -284 | -56 | -33 | -82 | 136 | -114 | -25 |
| 2023 | -120 | -165 | 42 | -99 | -64 | 222 | -244 | -198 | -148 | 322 | 176 | -139 |
| 2024 | -294 | |||||||||||
| - = No Data Reported; -- = Not Applicable; NA = Not Available; W = Withheld to avoid disclosure of individual company data. |
| Release Date: 3/29/2024 |
| Next Release Date: 4/30/2024 |