|
Download Data (XLS File) |
|
||||||||
|
||||||||
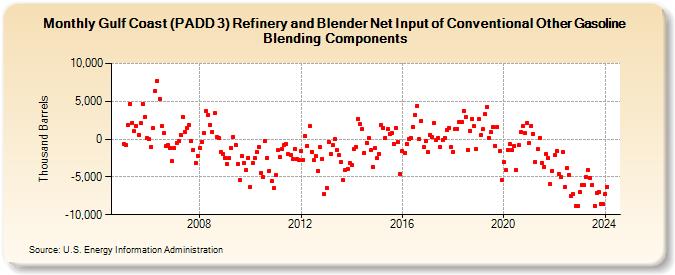
| Gulf Coast (PADD 3) Refinery and Blender Net Input of Conventional Other Gasoline Blending Components (Thousand Barrels) | ||||||||
| Year | Jan | Feb | Mar | Apr | May | Jun | Jul | Aug | Sep | Oct | Nov | Dec |
|---|---|---|---|---|---|---|---|---|---|---|---|---|
| 2005 | -680 | -787 | 1,862 | 4,654 | 2,178 | 1,023 | 1,761 | 605 | 2,063 | 4,622 | 2,935 | 90 |
| 2006 | -6 | -1,021 | 1,406 | 6,366 | 7,702 | 5,346 | 1,719 | 803 | -973 | -820 | -1,161 | -2,962 |
| 2007 | -1,149 | -493 | -235 | 587 | 2,909 | 1,000 | 1,446 | 1,869 | -286 | -1,427 | -3,158 | -2,278 |
| 2008 | -1,127 | -365 | 748 | 3,700 | 3,189 | 1,929 | 949 | 3,389 | 263 | 120 | -1,652 | -1,994 |
| 2009 | -2,479 | -3,300 | -2,563 | -1,160 | 284 | -764 | -3,232 | -5,432 | -2,243 | -3,095 | -4,039 | -2,494 |
| 2010 | -6,288 | -3,138 | -2,462 | -1,665 | -991 | -4,452 | -5,026 | -226 | -2,477 | -4,167 | -5,554 | -6,520 |
| 2011 | -4,793 | -1,482 | -2,428 | -1,352 | -747 | -650 | -2,005 | -2,079 | -2,698 | -1,314 | -2,688 | -2,705 |
| 2012 | -1,583 | -2,730 | 393 | -874 | 1,697 | -1,654 | -2,829 | -2,254 | -4,161 | -1,081 | -2,596 | -7,304 |
| 2013 | -6,435 | -330 | -1,998 | -832 | -53 | -1,467 | -2,161 | -3,046 | -5,443 | -4,036 | -3,936 | -3,165 |
| 2014 | -3,477 | -1,364 | -1,028 | 2,713 | 1,984 | 1,331 | -1,784 | -450 | 135 | -1,491 | -3,664 | -1,187 |
| 2015 | -2,550 | -1,906 | 1,906 | 1,474 | 193 | 1,360 | 718 | 763 | -612 | 1,474 | -355 | -4,633 |
| 2016 | -1,572 | -1,822 | -647 | 42 | 167 | 1,666 | 3,232 | 4,436 | -50 | 2,446 | -1,091 | -316 |
| 2017 | -1,731 | 602 | 219 | 2,139 | -116 | 168 | -1,047 | -59 | 165 | 1,180 | 1,521 | -1,111 |
| 2018 | -1,673 | 1,318 | 1,396 | 2,270 | 2,282 | 3,768 | 2,914 | -1,419 | 1,115 | 2,714 | 1,714 | -1,311 |
| 2019 | 2,653 | 533 | 1,271 | 3,271 | 4,287 | 189 | 898 | 1,600 | -848 | 1,583 | -1,580 | -5,420 |
| 2020 | -3,027 | -4,145 | -1,438 | -692 | -1,466 | -887 | -4,070 | -824 | 876 | 1,689 | 750 | 2,147 |
| 2021 | -557 | 1,737 | 684 | -2,971 | -1,362 | 181 | -3,098 | -3,685 | -2,012 | -2,560 | -5,940 | -4,156 |
| 2022 | -2,112 | -1,592 | -4,628 | -4,951 | -1,733 | -6,281 | -3,811 | -4,683 | -7,477 | -7,310 | -8,818 | -8,791 |
| 2023 | -7,040 | -6,058 | -6,076 | -5,010 | -4,109 | -5,139 | -6,034 | -8,797 | -7,093 | -7,010 | -8,559 | -8,561 |
| 2024 | -7,258 | |||||||||||
| - = No Data Reported; -- = Not Applicable; NA = Not Available; W = Withheld to avoid disclosure of individual company data. |
| Release Date: 3/29/2024 |
| Next Release Date: 4/30/2024 |