|
Download Data (XLS File) |
|
||||||||
|
||||||||
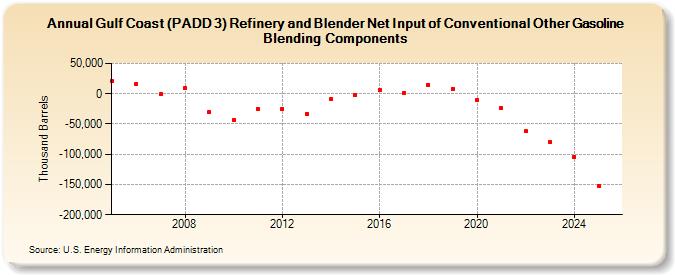
| Gulf Coast (PADD 3) Refinery and Blender Net Input of Conventional Other Gasoline Blending Components (Thousand Barrels) | ||||||||
| Decade | Year-0 | Year-1 | Year-2 | Year-3 | Year-4 | Year-5 | Year-6 | Year-7 | Year-8 | Year-9 |
|---|---|---|---|---|---|---|---|---|---|---|
| 2000's | 20,326 | 16,399 | -1,215 | 9,149 | -30,517 | |||||
| 2010's | -42,966 | -24,941 | -24,976 | -32,902 | -8,282 | -2,168 | 6,491 | 1,930 | 15,088 | 8,437 |
| 2020's | -11,087 | -23,739 | -62,187 | -79,486 |
| - = No Data Reported; -- = Not Applicable; NA = Not Available; W = Withheld to avoid disclosure of individual company data. |
| Release Date: 3/29/2024 |
| Next Release Date: 8/30/2024 |