|
Download Data (XLS File) |
|
||||||||
|
||||||||
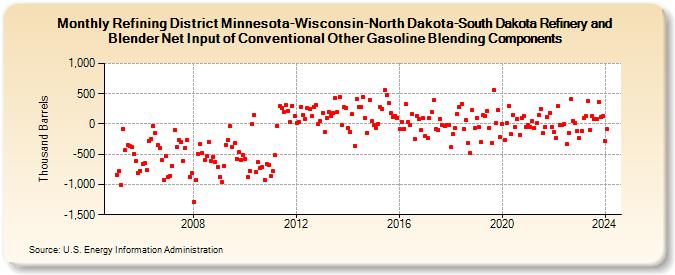
| Refining District Minnesota-Wisconsin-North Dakota-South Dakota Refinery and Blender Net Input of Conventional Other Gasoline Blending Components (Thousand Barrels) | ||||||||
| Year | Jan | Feb | Mar | Apr | May | Jun | Jul | Aug | Sep | Oct | Nov | Dec |
|---|---|---|---|---|---|---|---|---|---|---|---|---|
| 2005 | -842 | -783 | -1,005 | -77 | -438 | -351 | -365 | -387 | -495 | -605 | -808 | -771 |
| 2006 | -658 | -647 | -767 | -278 | -247 | -28 | -152 | -347 | -402 | -592 | -918 | -531 |
| 2007 | -874 | -854 | -693 | -102 | -385 | -260 | -296 | -608 | -396 | -257 | -872 | -816 |
| 2008 | -1,284 | -922 | -494 | -327 | -482 | -596 | -536 | -293 | -606 | -538 | -625 | -706 |
| 2009 | -869 | -967 | -690 | -341 | -268 | -40 | -385 | -309 | -582 | -469 | -594 | -513 |
| 2010 | -577 | -881 | -772 | -5 | 153 | -795 | -633 | -733 | -715 | -924 | -669 | -684 |
| 2011 | -860 | -783 | -521 | -33 | 297 | 270 | 206 | 312 | 219 | 32 | 302 | 131 |
| 2012 | 16 | 29 | 285 | 151 | 89 | 256 | 253 | 127 | 283 | 312 | -5 | 55 |
| 2013 | 186 | -137 | 105 | 197 | 135 | 175 | 427 | 198 | 453 | -11 | 273 | 270 |
| 2014 | -69 | -137 | 161 | -364 | 420 | 284 | 279 | 448 | 93 | -146 | 397 | 45 |
| 2015 | -24 | -71 | 4 | 279 | 255 | 559 | 473 | 350 | 179 | 115 | 128 | 106 |
| 2016 | -90 | 38 | -75 | 324 | 26 | -12 | 162 | -246 | 130 | 74 | -107 | 91 |
| 2017 | -203 | -228 | 91 | 195 | 396 | -87 | -93 | 87 | -16 | -39 | -10 | -18 |
| 2018 | -385 | -172 | -64 | 167 | 274 | 335 | -86 | 64 | -314 | -484 | 227 | -69 |
| 2019 | 101 | -58 | -303 | 141 | 128 | 219 | -61 | -315 | 561 | 22 | 224 | -221 |
| 2020 | 0 | -259 | 9 | 303 | -164 | 154 | -44 | 77 | -177 | 102 | 140 | -43 |
| 2021 | -19 | -55 | 49 | -59 | 9 | 150 | 254 | -150 | -51 | 115 | 189 | -51 |
| 2022 | -131 | -225 | 303 | -11 | -17 | -6 | -336 | -145 | 407 | 46 | 16 | -119 |
| 2023 | -234 | -116 | 93 | 127 | 372 | -93 | 134 | 90 | 79 | 369 | 114 | 129 |
| 2024 | -286 | |||||||||||
| - = No Data Reported; -- = Not Applicable; NA = Not Available; W = Withheld to avoid disclosure of individual company data. |
| Release Date: 3/29/2024 |
| Next Release Date: 4/30/2024 |