|
Download Data (XLS File) |
|
||||||||
|
||||||||
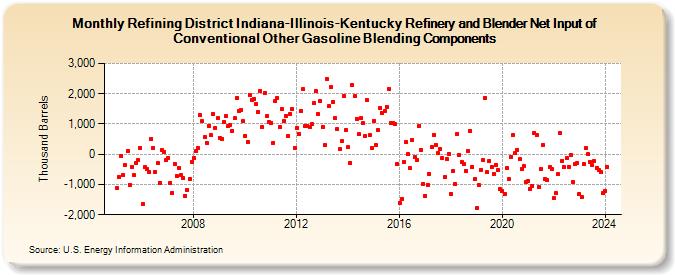
| Refining District Indiana-Illinois-Kentucky Refinery and Blender Net Input of Conventional Other Gasoline Blending Components (Thousand Barrels) | ||||||||
| Year | Jan | Feb | Mar | Apr | May | Jun | Jul | Aug | Sep | Oct | Nov | Dec |
|---|---|---|---|---|---|---|---|---|---|---|---|---|
| 2005 | -1,122 | -740 | -56 | -686 | -367 | 90 | -1,006 | -421 | -693 | -274 | -191 | 216 |
| 2006 | -1,660 | -428 | -477 | -593 | 516 | 207 | -587 | -300 | -935 | 134 | 79 | -205 |
| 2007 | -116 | -939 | -1,267 | -320 | -706 | -445 | -700 | -800 | -1,371 | -1,179 | -804 | -241 |
| 2008 | -140 | 107 | 220 | 1,291 | 1,085 | 556 | 376 | 949 | 627 | 1,322 | 876 | 1,183 |
| 2009 | 551 | 498 | 1,052 | 1,250 | 919 | 969 | 776 | 1,194 | 1,863 | 1,422 | 1,469 | 1,090 |
| 2010 | 614 | 412 | 1,971 | 1,798 | 1,835 | 1,657 | 1,410 | 2,088 | 902 | 2,015 | 1,252 | 1,068 |
| 2011 | 1,045 | 380 | 1,745 | 1,859 | 906 | 1,490 | 1,090 | 1,280 | 606 | 1,345 | 1,491 | 211 |
| 2012 | 883 | 677 | 1,443 | 2,141 | 925 | 944 | 914 | 990 | 1,677 | 2,074 | 1,325 | 1,760 |
| 2013 | 916 | 301 | 2,500 | 1,584 | 2,227 | 1,722 | 1,197 | 830 | 159 | 428 | 1,921 | 803 |
| 2014 | 230 | -285 | 2,291 | 1,917 | 1,175 | 660 | 1,195 | 1,016 | 615 | 1,779 | 627 | 197 |
| 2015 | 1,111 | 295 | 795 | 1,542 | 1,379 | 1,417 | 1,574 | 2,162 | 1,039 | 1,046 | 987 | -311 |
| 2016 | -1,601 | -1,475 | -251 | 402 | -8 | -464 | 463 | -99 | -175 | 921 | 146 | -977 |
| 2017 | -1,371 | -1,006 | -647 | 227 | 645 | 318 | 42 | 182 | -119 | -769 | -171 | 16 |
| 2018 | -1,299 | -553 | -984 | 676 | -25 | -265 | -336 | -541 | 112 | 781 | -413 | -825 |
| 2019 | -1,788 | -1,014 | -512 | -193 | 1,870 | -591 | -220 | -425 | -644 | -343 | -533 | -1,160 |
| 2020 | -1,217 | -1,320 | -454 | -832 | -85 | 634 | 39 | 152 | -167 | -481 | -405 | -907 |
| 2021 | -895 | -1,149 | -1,043 | 704 | 632 | -1,079 | -488 | 305 | -821 | -853 | -424 | -492 |
| 2022 | -1,456 | -1,283 | -643 | 703 | -212 | -436 | -132 | -407 | -25 | -931 | -309 | -286 |
| 2023 | -1,319 | -1,417 | -328 | 196 | 1 | -241 | -365 | -228 | -445 | -535 | -603 | -1,285 |
| 2024 | -1,225 | |||||||||||
| - = No Data Reported; -- = Not Applicable; NA = Not Available; W = Withheld to avoid disclosure of individual company data. |
| Release Date: 3/29/2024 |
| Next Release Date: 4/30/2024 |