|
Download Data (XLS File) |
|
||||||||
|
||||||||
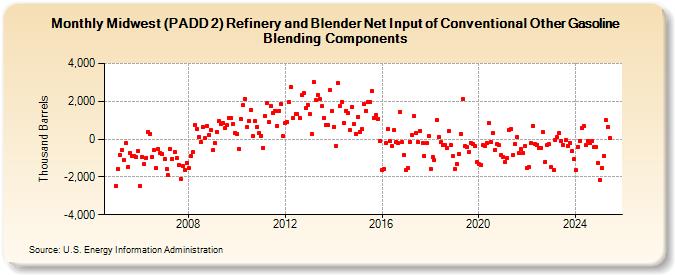
| Midwest (PADD 2) Refinery and Blender Net Input of Conventional Other Gasoline Blending Components (Thousand Barrels) | ||||||||
| Year | Jan | Feb | Mar | Apr | May | Jun | Jul | Aug | Sep | Oct | Nov | Dec |
|---|---|---|---|---|---|---|---|---|---|---|---|---|
| 2005 | -2,461 | -1,589 | -830 | -589 | -1,094 | -227 | -1,458 | -737 | -892 | -895 | -958 | -640 |
| 2006 | -2,467 | -931 | -1,331 | -979 | 398 | 281 | -927 | -580 | -1,537 | -502 | -731 | -790 |
| 2007 | -1,053 | -1,587 | -1,913 | -527 | -1,027 | -665 | -978 | -1,373 | -2,088 | -1,401 | -1,609 | -1,257 |
| 2008 | -1,552 | -904 | -707 | 758 | 550 | 89 | -168 | 615 | 34 | 708 | 214 | 468 |
| 2009 | -582 | -212 | 394 | 931 | 778 | 853 | 580 | 723 | 1,119 | 1,132 | 801 | 329 |
| 2010 | 253 | -535 | 1,057 | 1,779 | 2,130 | 622 | 971 | 1,526 | 152 | 935 | 666 | 331 |
| 2011 | 165 | -445 | 1,224 | 1,913 | 883 | 1,747 | 1,369 | 1,500 | 699 | 1,502 | 1,849 | 155 |
| 2012 | 849 | 895 | 1,961 | 2,750 | 1,120 | 1,333 | 1,309 | 1,138 | 2,315 | 2,414 | 1,625 | 1,819 |
| 2013 | 1,303 | 270 | 3,036 | 2,046 | 2,333 | 2,118 | 1,737 | 1,131 | 732 | 721 | 2,585 | 1,489 |
| 2014 | 646 | -365 | 2,980 | 1,727 | 1,964 | 840 | 1,507 | 1,356 | 472 | 1,688 | 791 | 292 |
| 2015 | 1,185 | 382 | 528 | 1,854 | 1,512 | 1,964 | 1,961 | 2,549 | 1,128 | 1,261 | 1,088 | -107 |
| 2016 | -1,614 | -1,578 | -206 | 524 | -103 | -384 | 457 | -150 | -229 | 1,448 | -174 | -837 |
| 2017 | -1,641 | -1,551 | -143 | 216 | 1,198 | 348 | -168 | 434 | -228 | -905 | -209 | 152 |
| 2018 | -1,581 | -951 | -1,130 | 993 | 111 | -169 | -333 | -298 | -449 | 419 | -336 | -920 |
| 2019 | -1,585 | -1,314 | -787 | 273 | 2,109 | -379 | -417 | -662 | -211 | -238 | -371 | -1,219 |
| 2020 | -1,340 | -1,377 | -335 | -389 | -208 | 847 | -159 | 319 | -565 | -276 | -327 | -842 |
| 2021 | -943 | -1,203 | -997 | 503 | 544 | -835 | -245 | 106 | -745 | -530 | -717 | -370 |
| 2022 | -1,536 | -1,485 | -226 | 700 | -263 | -294 | -476 | -455 | 361 | -1,187 | -291 | -274 |
| 2023 | -1,482 | -1,642 | -47 | 93 | 318 | -97 | -308 | -69 | -342 | -201 | -644 | -1,075 |
| 2024 | -1,646 | |||||||||||
| - = No Data Reported; -- = Not Applicable; NA = Not Available; W = Withheld to avoid disclosure of individual company data. |
| Release Date: 3/29/2024 |
| Next Release Date: 4/30/2024 |