|
Download Data (XLS File) |
|
||||||||
|
||||||||
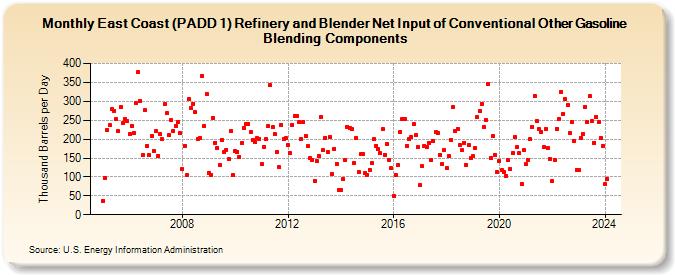
| East Coast (PADD 1) Refinery and Blender Net Input of Conventional Other Gasoline Blending Components (Thousand Barrels per Day) | ||||||||
| Year | Jan | Feb | Mar | Apr | May | Jun | Jul | Aug | Sep | Oct | Nov | Dec |
|---|---|---|---|---|---|---|---|---|---|---|---|---|
| 2005 | 37 | 96 | 225 | 236 | 279 | 275 | 252 | 221 | 284 | 242 | 254 | 248 |
| 2006 | 214 | 235 | 217 | 295 | 377 | 301 | 157 | 276 | 183 | 157 | 208 | 169 |
| 2007 | 221 | 156 | 214 | 199 | 292 | 268 | 211 | 250 | 221 | 235 | 246 | 215 |
| 2008 | 121 | 183 | 104 | 305 | 282 | 293 | 271 | 200 | 203 | 368 | 235 | 319 |
| 2009 | 111 | 106 | 256 | 191 | 177 | 132 | 197 | 166 | 172 | 147 | 221 | 106 |
| 2010 | 168 | 167 | 153 | 190 | 230 | 239 | 240 | 219 | 197 | 192 | 202 | 201 |
| 2011 | 134 | 180 | 200 | 234 | 343 | 231 | 214 | 167 | 125 | 238 | 199 | 202 |
| 2012 | 185 | 163 | 238 | 262 | 260 | 244 | 200 | 245 | 209 | 181 | 149 | 146 |
| 2013 | 90 | 142 | 155 | 258 | 170 | 204 | 166 | 205 | 109 | 175 | 135 | 66 |
| 2014 | 65 | 95 | 144 | 233 | 229 | 226 | 137 | 202 | 112 | 160 | 161 | 110 |
| 2015 | 106 | 119 | 136 | 200 | 183 | 173 | 162 | 226 | 159 | 187 | 144 | 123 |
| 2016 | 49 | 105 | 131 | 219 | 254 | 253 | 183 | 200 | 206 | 240 | 210 | 180 |
| 2017 | 78 | 128 | 183 | 179 | 191 | 145 | 196 | 219 | 215 | 159 | 135 | 170 |
| 2018 | 124 | 154 | 198 | 285 | 222 | 227 | 184 | 171 | 191 | 132 | 184 | 150 |
| 2019 | 154 | 176 | 258 | 273 | 294 | 233 | 251 | 346 | 150 | 207 | 159 | 112 |
| 2020 | 142 | 117 | 112 | 103 | 144 | 121 | 163 | 206 | 179 | 162 | 82 | 171 |
| 2021 | 133 | 146 | 199 | 233 | 314 | 248 | 226 | 220 | 178 | 227 | 177 | 147 |
| 2022 | 88 | 146 | 228 | 253 | 325 | 267 | 305 | 290 | 216 | 245 | 195 | 119 |
| 2023 | 118 | 204 | 214 | 286 | 244 | 313 | 249 | 191 | 258 | 245 | 203 | 183 |
| 2024 | 81 | |||||||||||
| - = No Data Reported; -- = Not Applicable; NA = Not Available; W = Withheld to avoid disclosure of individual company data. |
| Release Date: 3/29/2024 |
| Next Release Date: 4/30/2024 |