|
Download Data (XLS File) |
|
||||||||
|
||||||||
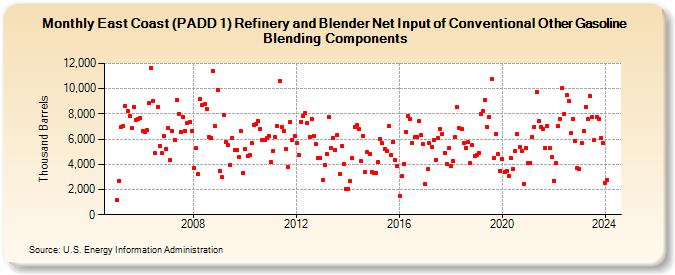
| East Coast (PADD 1) Refinery and Blender Net Input of Conventional Other Gasoline Blending Components (Thousand Barrels) | ||||||||
| Year | Jan | Feb | Mar | Apr | May | Jun | Jul | Aug | Sep | Oct | Nov | Dec |
|---|---|---|---|---|---|---|---|---|---|---|---|---|
| 2005 | 1,140 | 2,686 | 6,962 | 7,075 | 8,653 | 8,250 | 7,820 | 6,857 | 8,521 | 7,495 | 7,633 | 7,696 |
| 2006 | 6,627 | 6,593 | 6,715 | 8,841 | 11,678 | 9,026 | 4,876 | 8,568 | 5,488 | 4,863 | 6,247 | 5,249 |
| 2007 | 6,846 | 4,354 | 6,624 | 5,968 | 9,063 | 8,027 | 6,533 | 7,735 | 6,633 | 7,280 | 7,379 | 6,678 |
| 2008 | 3,739 | 5,298 | 3,216 | 9,160 | 8,743 | 8,789 | 8,405 | 6,196 | 6,103 | 11,400 | 7,038 | 9,902 |
| 2009 | 3,455 | 2,964 | 7,924 | 5,738 | 5,497 | 3,963 | 6,096 | 5,141 | 5,155 | 4,563 | 6,632 | 3,298 |
| 2010 | 5,209 | 4,668 | 4,756 | 5,703 | 7,144 | 7,169 | 7,451 | 6,798 | 5,921 | 5,950 | 6,048 | 6,229 |
| 2011 | 4,167 | 5,027 | 6,203 | 7,012 | 10,640 | 6,940 | 6,623 | 5,186 | 3,751 | 7,363 | 5,963 | 6,275 |
| 2012 | 5,729 | 4,721 | 7,367 | 7,849 | 8,059 | 7,316 | 6,202 | 7,594 | 6,271 | 5,624 | 4,484 | 4,537 |
| 2013 | 2,776 | 3,967 | 4,813 | 7,735 | 5,259 | 6,115 | 5,151 | 6,340 | 3,268 | 5,419 | 4,036 | 2,040 |
| 2014 | 2,001 | 2,646 | 4,472 | 6,997 | 7,088 | 6,790 | 4,246 | 6,251 | 3,352 | 4,948 | 4,831 | 3,403 |
| 2015 | 3,298 | 3,319 | 4,217 | 5,993 | 5,665 | 5,178 | 5,025 | 7,013 | 4,764 | 5,799 | 4,321 | 3,828 |
| 2016 | 1,517 | 3,043 | 4,054 | 6,564 | 7,866 | 7,597 | 5,684 | 6,193 | 6,168 | 7,433 | 6,286 | 5,590 |
| 2017 | 2,431 | 3,591 | 5,685 | 5,379 | 5,922 | 4,362 | 6,065 | 6,803 | 6,437 | 4,914 | 4,061 | 5,264 |
| 2018 | 3,831 | 4,301 | 6,142 | 8,544 | 6,867 | 6,809 | 5,689 | 5,310 | 5,736 | 4,086 | 5,513 | 4,646 |
| 2019 | 4,765 | 4,917 | 8,003 | 8,191 | 9,114 | 6,980 | 7,768 | 10,732 | 4,507 | 6,421 | 4,783 | 3,484 |
| 2020 | 4,400 | 3,395 | 3,462 | 3,088 | 4,475 | 3,644 | 5,041 | 6,381 | 5,363 | 5,035 | 2,462 | 5,316 |
| 2021 | 4,125 | 4,097 | 6,181 | 6,995 | 9,727 | 7,426 | 6,993 | 6,835 | 5,331 | 7,033 | 5,304 | 4,559 |
| 2022 | 2,713 | 4,095 | 7,057 | 7,582 | 10,064 | 8,015 | 9,470 | 9,003 | 6,465 | 7,587 | 5,855 | 3,677 |
| 2023 | 3,643 | 5,709 | 5,743 | 8,568 | 7,563 | 9,397 | 7,722 | 5,929 | 7,735 | 7,605 | 6,080 | 5,678 |
| 2024 | 2,520 | 2,726 | 5,120 | 8,022 | 7,934 | 6,192 | ||||||
| - = No Data Reported; -- = Not Applicable; NA = Not Available; W = Withheld to avoid disclosure of individual company data. |
| Release Date: 8/30/2024 |
| Next Release Date: 9/30/2024 |