|
Download Data (XLS File) |
|
||||||||
|
||||||||
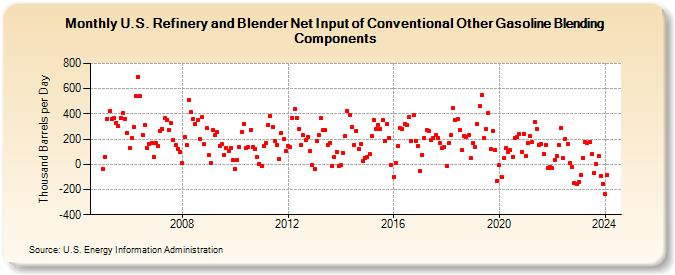
| U.S. Refinery and Blender Net Input of Conventional Other Gasoline Blending Components (Thousand Barrels per Day) | ||||||||
| Year | Jan | Feb | Mar | Apr | May | Jun | Jul | Aug | Sep | Oct | Nov | Dec |
|---|---|---|---|---|---|---|---|---|---|---|---|---|
| 2005 | -38 | 59 | 363 | 422 | 362 | 366 | 328 | 306 | 368 | 404 | 358 | 251 |
| 2006 | 128 | 210 | 296 | 541 | 693 | 539 | 236 | 311 | 127 | 159 | 172 | 60 |
| 2007 | 170 | 146 | 266 | 282 | 364 | 352 | 269 | 326 | 190 | 153 | 121 | 99 |
| 2008 | 13 | 215 | 152 | 509 | 414 | 359 | 323 | 350 | 202 | 373 | 161 | 288 |
| 2009 | 71 | 11 | 270 | 232 | 253 | 147 | 162 | 70 | 131 | 107 | 130 | 31 |
| 2010 | -36 | 38 | 137 | 257 | 317 | 131 | 135 | 275 | 134 | 119 | 54 | 4 |
| 2011 | -16 | 147 | 166 | 312 | 384 | 298 | 186 | 154 | 42 | 248 | 202 | 105 |
| 2012 | 149 | 135 | 370 | 437 | 371 | 280 | 154 | 231 | 189 | 215 | 105 | -5 |
| 2013 | -39 | 187 | 229 | 364 | 272 | 271 | 154 | 167 | -10 | 59 | 101 | -12 |
| 2014 | -8 | 90 | 222 | 421 | 395 | 297 | 152 | 261 | 122 | 162 | 25 | 52 |
| 2015 | 56 | 78 | 226 | 353 | 277 | 313 | 283 | 354 | 184 | 318 | 209 | -6 |
| 2016 | -98 | 14 | 147 | 286 | 284 | 322 | 311 | 374 | 183 | 388 | 181 | 147 |
| 2017 | -53 | 76 | 212 | 272 | 267 | 190 | 208 | 233 | 209 | 166 | 126 | 135 |
| 2018 | -10 | 170 | 229 | 447 | 349 | 360 | 270 | 114 | 228 | 220 | 229 | 47 |
| 2019 | 172 | 135 | 319 | 465 | 548 | 211 | 282 | 411 | 120 | 263 | 115 | -130 |
| 2020 | -9 | -101 | 48 | 133 | 101 | 110 | 58 | 212 | 213 | 244 | 101 | 243 |
| 2021 | 64 | 166 | 228 | 174 | 338 | 283 | 157 | 158 | 83 | 157 | -33 | -22 |
| 2022 | -32 | 36 | 65 | 153 | 290 | 47 | 199 | 164 | 10 | -25 | -149 | -157 |
| 2023 | -137 | -82 | 52 | 178 | 171 | 176 | 79 | -70 | 6 | 63 | -90 | -153 |
| 2024 | -234 | |||||||||||
| - = No Data Reported; -- = Not Applicable; NA = Not Available; W = Withheld to avoid disclosure of individual company data. |
| Release Date: 3/29/2024 |
| Next Release Date: 4/30/2024 |