|
Download Data (XLS File) |
|
||||||||
|
||||||||
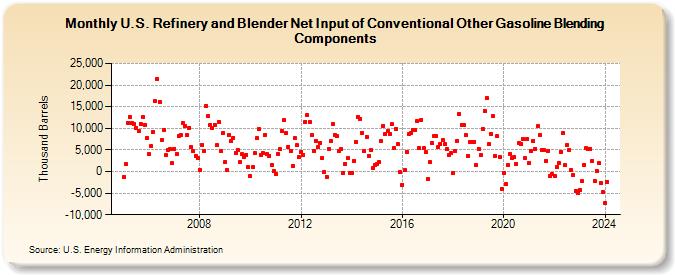
| U.S. Refinery and Blender Net Input of Conventional Other Gasoline Blending Components (Thousand Barrels) | ||||||||
| Year | Jan | Feb | Mar | Apr | May | Jun | Jul | Aug | Sep | Oct | Nov | Dec |
|---|---|---|---|---|---|---|---|---|---|---|---|---|
| 2005 | -1,168 | 1,655 | 11,266 | 12,665 | 11,234 | 10,973 | 10,156 | 9,473 | 11,050 | 12,510 | 10,749 | 7,776 |
| 2006 | 3,964 | 5,891 | 9,164 | 16,241 | 21,472 | 16,173 | 7,325 | 9,648 | 3,806 | 4,934 | 5,146 | 1,859 |
| 2007 | 5,273 | 4,096 | 8,250 | 8,450 | 11,291 | 10,561 | 8,339 | 10,092 | 5,695 | 4,741 | 3,637 | 3,054 |
| 2008 | 407 | 6,225 | 4,708 | 15,270 | 12,839 | 10,759 | 9,999 | 10,852 | 6,052 | 11,548 | 4,820 | 8,929 |
| 2009 | 2,188 | 314 | 8,377 | 6,950 | 7,833 | 4,396 | 5,022 | 2,167 | 3,944 | 3,313 | 3,893 | 965 |
| 2010 | -1,122 | 1,065 | 4,261 | 7,696 | 9,832 | 3,921 | 4,187 | 8,520 | 4,034 | 3,686 | 1,616 | 110 |
| 2011 | -485 | 4,111 | 5,145 | 9,372 | 11,914 | 8,950 | 5,768 | 4,769 | 1,253 | 7,689 | 6,059 | 3,264 |
| 2012 | 4,612 | 3,902 | 11,479 | 13,110 | 11,491 | 8,403 | 4,763 | 7,168 | 5,656 | 6,679 | 3,153 | -146 |
| 2013 | -1,194 | 5,230 | 7,095 | 10,921 | 8,422 | 8,130 | 4,774 | 5,173 | -293 | 1,816 | 3,038 | -384 |
| 2014 | -241 | 2,532 | 6,892 | 12,632 | 12,245 | 8,921 | 4,710 | 8,093 | 3,671 | 5,023 | 739 | 1,601 |
| 2015 | 1,750 | 2,180 | 7,011 | 10,601 | 8,588 | 9,375 | 8,783 | 10,960 | 5,508 | 9,848 | 6,272 | -198 |
| 2016 | -3,053 | 412 | 4,551 | 8,583 | 8,819 | 9,652 | 9,651 | 11,595 | 5,498 | 12,023 | 5,415 | 4,552 |
| 2017 | -1,654 | 2,140 | 6,569 | 8,156 | 8,270 | 5,713 | 6,461 | 7,233 | 6,271 | 5,131 | 3,770 | 4,200 |
| 2018 | -302 | 4,772 | 7,094 | 13,412 | 10,809 | 10,802 | 8,358 | 3,534 | 6,831 | 6,833 | 6,882 | 1,462 |
| 2019 | 5,324 | 3,781 | 9,875 | 13,959 | 16,978 | 6,343 | 8,745 | 12,745 | 3,614 | 8,155 | 3,460 | -4,026 |
| 2020 | -286 | -2,921 | 1,502 | 4,001 | 3,136 | 3,290 | 1,802 | 6,585 | 6,383 | 7,559 | 3,036 | 7,525 |
| 2021 | 1,993 | 4,659 | 7,062 | 5,208 | 10,467 | 8,501 | 4,871 | 4,894 | 2,493 | 4,854 | -989 | -674 |
| 2022 | -994 | 1,018 | 2,017 | 4,577 | 8,996 | 1,412 | 6,184 | 5,078 | 303 | -770 | -4,473 | -4,881 |
| 2023 | -4,243 | -2,282 | 1,598 | 5,339 | 5,291 | 5,269 | 2,449 | -2,173 | 187 | 1,947 | -2,701 | -4,758 |
| 2024 | -7,265 | |||||||||||
| - = No Data Reported; -- = Not Applicable; NA = Not Available; W = Withheld to avoid disclosure of individual company data. |
| Release Date: 3/29/2024 |
| Next Release Date: 4/30/2024 |