|
Download Data (XLS File) |
|
||||||||
|
||||||||
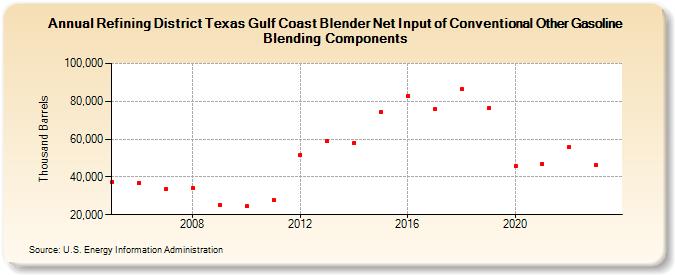
| Refining District Texas Gulf Coast Blender Net Input of Conventional Other Gasoline Blending Components (Thousand Barrels) | ||||||||
| Decade | Year-0 | Year-1 | Year-2 | Year-3 | Year-4 | Year-5 | Year-6 | Year-7 | Year-8 | Year-9 |
|---|---|---|---|---|---|---|---|---|---|---|
| 2000's | 37,567 | 37,032 | 33,599 | 34,044 | 25,210 | |||||
| 2010's | 24,434 | 27,954 | 51,628 | 58,885 | 58,085 | 74,555 | 82,809 | 75,702 | 86,270 | 76,211 |
| 2020's | 45,528 | 47,073 | 55,896 | 46,103 |
| - = No Data Reported; -- = Not Applicable; NA = Not Available; W = Withheld to avoid disclosure of individual company data. |
| Release Date: 4/30/2024 |
| Next Release Date: 8/30/2024 |