|
Download Data (XLS File) |
|
||||||||
|
||||||||
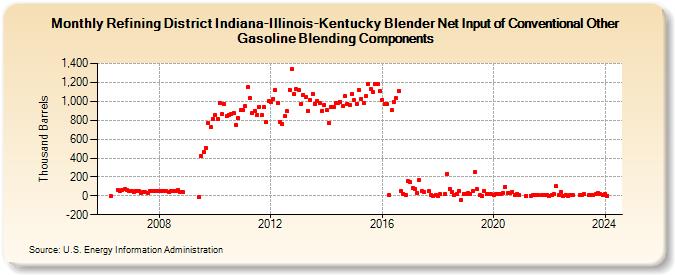
| Refining District Indiana-Illinois-Kentucky Blender Net Input of Conventional Other Gasoline Blending Components (Thousand Barrels) | ||||||||
| Year | Jan | Feb | Mar | Apr | May | Jun | Jul | Aug | Sep | Oct | Nov | Dec |
|---|---|---|---|---|---|---|---|---|---|---|---|---|
| 2006 | -6 | 65 | 55 | 65 | 70 | 60 | 46 | |||||
| 2007 | 49 | 40 | 53 | 50 | 31 | 42 | 37 | 33 | 48 | 46 | 47 | 51 |
| 2008 | 51 | 48 | 47 | 48 | 41 | 54 | 54 | 52 | 59 | 44 | 37 | |
| 2009 | -13 | 422 | 463 | 511 | 768 | 723 | 814 | |||||
| 2010 | 850 | 817 | 983 | 865 | 969 | 844 | 859 | 870 | 874 | 753 | 823 | 904 |
| 2011 | 906 | 946 | 1,148 | 1,033 | 875 | 898 | 853 | 941 | 852 | 935 | 782 | 1,000 |
| 2012 | 990 | 1,025 | 1,117 | 983 | 786 | 764 | 841 | 893 | 1,124 | 1,337 | 1,074 | 1,125 |
| 2013 | 1,116 | 975 | 1,068 | 1,046 | 900 | 1,016 | 1,078 | 974 | 1,003 | 981 | 898 | 961 |
| 2014 | 905 | 772 | 940 | 937 | 979 | 977 | 994 | 949 | 1,052 | 976 | 963 | 1,080 |
| 2015 | 1,009 | 974 | 1,120 | 1,026 | 980 | 1,054 | 1,181 | 1,128 | 1,097 | 1,178 | 1,182 | 1,107 |
| 2016 | 1,014 | 972 | 967 | 4 | 908 | 994 | 1,034 | 1,112 | 55 | 24 | 5 | 152 |
| 2017 | 142 | 80 | 73 | 33 | 164 | 53 | 44 | 46 | 5 | 3 | 5 | |
| 2018 | 2 | 17 | 21 | 236 | 73 | 45 | 4 | 17 | 51 | -43 | 22 | |
| 2019 | 18 | 30 | 20 | 52 | 250 | 67 | 4 | 3 | 52 | 15 | 17 | 18 |
| 2020 | 5 | 23 | 16 | 21 | 30 | 98 | 29 | 32 | 44 | 12 | 17 | 9 |
| 2021 | 2 | 3 | 8 | 4 | 6 | 6 | 9 | 10 | ||||
| 2022 | 3 | 12 | 17 | 99 | 5 | 44 | -1 | 7 | 2 | 5 | 5 | |
| 2023 | 13 | 13 | 19 | 4 | 5 | 8 | 15 | 32 | 17 | 10 | ||
| 2024 | 24 | 2 | ||||||||||
| - = No Data Reported; -- = Not Applicable; NA = Not Available; W = Withheld to avoid disclosure of individual company data. |
| Release Date: 4/30/2024 |
| Next Release Date: 5/31/2024 |