|
Download Data (XLS File) |
|
||||||||
|
||||||||
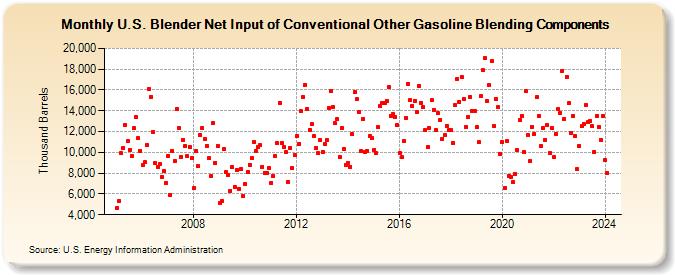
| U.S. Blender Net Input of Conventional Other Gasoline Blending Components (Thousand Barrels) | ||||||||
| Year | Jan | Feb | Mar | Apr | May | Jun | Jul | Aug | Sep | Oct | Nov | Dec |
|---|---|---|---|---|---|---|---|---|---|---|---|---|
| 2005 | 4,687 | 5,338 | 9,891 | 10,451 | 12,641 | 11,048 | 10,248 | 9,631 | 12,296 | 13,433 | 11,353 | 10,154 |
| 2006 | 8,773 | 9,038 | 10,729 | 16,080 | 15,365 | 11,982 | 8,952 | 8,637 | 8,846 | 7,671 | 8,218 | 7,040 |
| 2007 | 9,682 | 5,906 | 10,143 | 9,153 | 14,190 | 12,325 | 9,588 | 11,212 | 10,568 | 9,648 | 10,544 | 9,470 |
| 2008 | 6,585 | 10,147 | 8,682 | 11,661 | 12,354 | 11,300 | 10,654 | 9,413 | 7,737 | 12,825 | 8,981 | 10,612 |
| 2009 | 5,145 | 5,365 | 10,328 | 8,109 | 7,867 | 6,325 | 8,567 | 6,677 | 8,266 | 6,492 | 8,435 | 5,807 |
| 2010 | 6,975 | 8,098 | 8,823 | 9,449 | 11,040 | 10,128 | 10,535 | 10,663 | 8,625 | 8,052 | 7,999 | 8,524 |
| 2011 | 7,088 | 7,682 | 9,611 | 10,856 | 14,793 | 10,919 | 10,522 | 9,985 | 7,163 | 10,459 | 8,470 | 9,723 |
| 2012 | 11,556 | 10,804 | 13,942 | 15,307 | 16,466 | 14,165 | 12,177 | 12,679 | 11,527 | 10,447 | 9,903 | 11,158 |
| 2013 | 10,026 | 10,798 | 11,151 | 14,263 | 15,921 | 14,346 | 12,798 | 13,181 | 9,560 | 12,354 | 10,316 | 8,786 |
| 2014 | 8,953 | 8,619 | 11,731 | 15,800 | 15,095 | 13,863 | 10,129 | 13,221 | 10,034 | 10,163 | 11,596 | 11,346 |
| 2015 | 10,248 | 9,948 | 12,426 | 14,455 | 14,699 | 14,726 | 14,933 | 16,255 | 13,543 | 13,682 | 13,445 | 12,596 |
| 2016 | 9,900 | 9,509 | 11,064 | 13,347 | 16,575 | 15,021 | 14,488 | 14,973 | 13,916 | 16,380 | 14,780 | 14,355 |
| 2017 | 12,126 | 10,532 | 12,338 | 15,011 | 14,114 | 12,137 | 13,743 | 13,131 | 11,290 | 11,636 | 12,561 | 12,131 |
| 2018 | 12,137 | 10,919 | 14,518 | 17,092 | 14,843 | 17,229 | 15,143 | 12,439 | 13,394 | 15,369 | 13,962 | 13,959 |
| 2019 | 12,401 | 10,968 | 15,412 | 17,888 | 19,033 | 14,904 | 16,437 | 18,748 | 12,580 | 15,150 | 14,340 | 9,861 |
| 2020 | 10,949 | 6,578 | 11,049 | 7,767 | 7,671 | 7,129 | 7,896 | 10,192 | 13,098 | 13,529 | 10,029 | 15,865 |
| 2021 | 11,677 | 9,181 | 12,484 | 11,790 | 15,284 | 13,528 | 10,594 | 12,367 | 11,200 | 12,590 | 9,929 | 12,323 |
| 2022 | 9,530 | 11,797 | 14,152 | 13,756 | 17,873 | 13,218 | 17,278 | 14,710 | 11,874 | 13,527 | 11,560 | 8,370 |
| 2023 | 10,650 | 12,507 | 12,758 | 14,560 | 12,905 | 13,018 | 12,501 | 10,051 | 13,518 | 12,428 | 11,200 | 13,539 |
| 2024 | 9,255 | 8,036 | ||||||||||
| - = No Data Reported; -- = Not Applicable; NA = Not Available; W = Withheld to avoid disclosure of individual company data. |
| Release Date: 4/30/2024 |
| Next Release Date: 5/31/2024 |