|
Download Data (XLS File) |
|
||||||||
|
||||||||
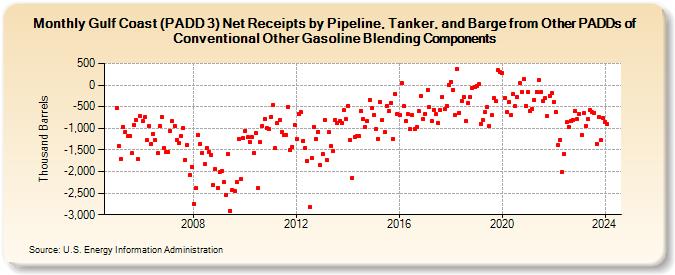
| Gulf Coast (PADD 3) Net Receipts by Pipeline, Tanker, and Barge from Other PADDs of Conventional Other Gasoline Blending Components (Thousand Barrels) | ||||||||
| Year | Jan | Feb | Mar | Apr | May | Jun | Jul | Aug | Sep | Oct | Nov | Dec |
|---|---|---|---|---|---|---|---|---|---|---|---|---|
| 2005 | -530 | -1,405 | -1,716 | -960 | -1,076 | -1,189 | -1,167 | -1,580 | -914 | -805 | -1,712 | -724 |
| 2006 | -832 | -735 | -1,278 | -940 | -1,355 | -1,131 | -1,268 | -1,581 | -955 | -737 | -1,453 | -1,559 |
| 2007 | -1,557 | -1,057 | -839 | -945 | -1,270 | -1,347 | -1,177 | -985 | -1,725 | -1,394 | -2,077 | -1,885 |
| 2008 | -2,751 | -2,383 | -1,159 | -1,358 | -1,565 | -1,833 | -1,451 | -1,559 | -1,611 | -2,323 | -1,943 | -2,378 |
| 2009 | -2,020 | -1,988 | -2,249 | -2,535 | -1,595 | -2,906 | -2,424 | -2,454 | -2,251 | -1,259 | -2,171 | -1,236 |
| 2010 | -1,055 | -1,212 | -1,307 | -1,203 | -1,569 | -1,117 | -2,391 | -1,324 | -936 | -775 | -993 | -1,021 |
| 2011 | -735 | -458 | -1,463 | -869 | -805 | -1,083 | -1,156 | -1,149 | -498 | -1,510 | -1,424 | -927 |
| 2012 | -1,256 | -669 | -630 | -1,283 | -1,450 | -1,758 | -2,816 | -1,685 | -961 | -1,243 | -1,083 | -1,857 |
| 2013 | -1,592 | -797 | -1,730 | -1,093 | -1,418 | -1,517 | -813 | -875 | -836 | -883 | -583 | -792 |
| 2014 | -474 | -1,271 | -2,141 | -1,210 | -1,187 | -1,185 | -594 | -783 | -980 | -834 | -336 | -532 |
| 2015 | -684 | -1,022 | -1,239 | -394 | -800 | -1,095 | -482 | -603 | -406 | -1,247 | -205 | -662 |
| 2016 | -694 | 37 | -493 | -837 | -679 | -1,024 | -695 | -1,019 | -975 | -611 | -258 | -778 |
| 2017 | -658 | -104 | -510 | -824 | -569 | -680 | -881 | -580 | -270 | -563 | -479 | -1 |
| 2018 | 78 | -107 | -688 | 364 | -641 | -373 | -265 | -837 | -418 | -277 | -60 | -53 |
| 2019 | -16 | 17 | -890 | -815 | -632 | -514 | -950 | -702 | -295 | -377 | 341 | 296 |
| 2020 | 289 | -291 | -626 | -392 | -702 | -212 | -492 | -286 | 39 | -161 | 132 | -474 |
| 2021 | -158 | -605 | -548 | -342 | -164 | 116 | -167 | -374 | -299 | -726 | -247 | -185 |
| 2022 | -391 | -621 | -1,396 | -1,260 | -2,018 | -1,600 | -864 | -964 | -822 | -813 | -609 | -791 |
| 2023 | -668 | -1,148 | -648 | -939 | -790 | -572 | -632 | -638 | -1,353 | -748 | -1,277 | -773 |
| 2024 | -848 | -907 | -1,205 | -750 | -1,175 | -703 | ||||||
| - = No Data Reported; -- = Not Applicable; NA = Not Available; W = Withheld to avoid disclosure of individual company data. |
| Release Date: 8/30/2024 |
| Next Release Date: 9/30/2024 |
Referring Pages: