|
Download Data (XLS File) |
|
||||||||
|
||||||||
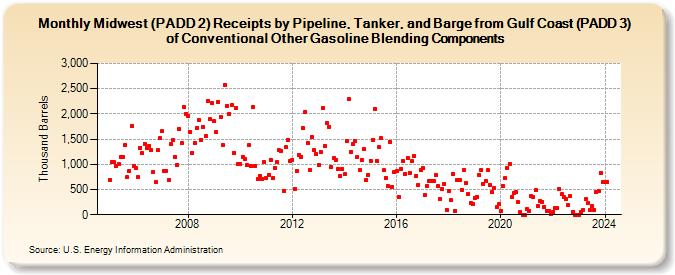
| Midwest (PADD 2) Receipts by Pipeline, Tanker, and Barge from Gulf Coast (PADD 3) of Conventional Other Gasoline Blending Components (Thousand Barrels) | ||||||||
| Year | Jan | Feb | Mar | Apr | May | Jun | Jul | Aug | Sep | Oct | Nov | Dec |
|---|---|---|---|---|---|---|---|---|---|---|---|---|
| 2005 | 695 | 1,050 | 1,037 | 957 | 998 | 1,141 | 1,154 | 1,379 | 741 | 866 | 1,763 | 973 |
| 2006 | 923 | 744 | 1,333 | 1,220 | 1,412 | 1,316 | 1,363 | 1,279 | 845 | 640 | 1,278 | 1,513 |
| 2007 | 1,654 | 869 | 871 | 683 | 1,395 | 1,479 | 1,148 | 994 | 1,701 | 1,419 | 2,138 | 2,006 |
| 2008 | 1,963 | 1,632 | 1,222 | 1,429 | 1,724 | 1,875 | 1,483 | 1,745 | 1,565 | 2,265 | 1,896 | 2,215 |
| 2009 | 1,853 | 1,635 | 2,231 | 1,943 | 1,385 | 2,568 | 2,162 | 2,007 | 2,172 | 1,234 | 2,126 | 1,010 |
| 2010 | 1,010 | 1,151 | 1,110 | 978 | 1,380 | 970 | 2,142 | 976 | 710 | 772 | 705 | 1,044 |
| 2011 | 727 | 790 | 1,092 | 725 | 929 | 1,041 | 1,276 | 1,273 | 472 | 1,341 | 1,491 | 1,063 |
| 2012 | 1,086 | 509 | 873 | 1,180 | 1,150 | 1,712 | 2,040 | 1,429 | 885 | 1,532 | 1,275 | 1,212 |
| 2013 | 995 | 1,250 | 2,121 | 1,369 | 1,823 | 1,745 | 943 | 1,123 | 1,095 | 916 | 774 | 905 |
| 2014 | 801 | 1,461 | 2,296 | 1,252 | 1,401 | 1,463 | 1,142 | 888 | 1,086 | 1,305 | 695 | 786 |
| 2015 | 1,073 | 1,490 | 2,100 | 1,070 | 1,343 | 1,513 | 879 | 738 | 575 | 1,449 | 557 | 847 |
| 2016 | 862 | 345 | 913 | 1,063 | 810 | 1,123 | 828 | 1,059 | 1,165 | 768 | 587 | 883 |
| 2017 | 925 | 395 | 570 | 664 | 677 | 663 | 780 | 573 | 302 | 505 | 617 | 90 |
| 2018 | 466 | 282 | 810 | 79 | 698 | 683 | 499 | 887 | 633 | 406 | 236 | 205 |
| 2019 | 338 | 355 | 793 | 889 | 615 | 678 | 880 | 597 | 448 | 536 | 149 | 204 |
| 2020 | 80 | 569 | 719 | 934 | 1,013 | 348 | 428 | 445 | 243 | 48 | 0 | 0 |
| 2021 | 106 | 81 | 374 | 342 | 482 | 178 | 273 | 259 | 161 | 70 | 82 | 7 |
| 2022 | 50 | 126 | 142 | 502 | 406 | 348 | 314 | 198 | 363 | 58 | 0 | 0 |
| 2023 | 0 | 53 | 100 | 304 | 226 | 86 | 167 | 100 | 452 | 465 | 835 | 653 |
| 2024 | 653 | |||||||||||
| - = No Data Reported; -- = Not Applicable; NA = Not Available; W = Withheld to avoid disclosure of individual company data. |
| Release Date: 3/29/2024 |
| Next Release Date: 4/30/2024 |