|
Download Data (XLS File) |
|
||||||||
|
||||||||
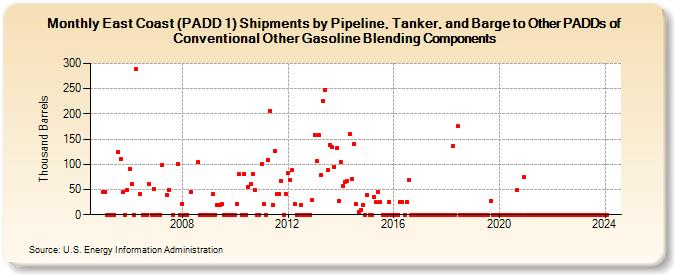
| East Coast (PADD 1) Shipments by Pipeline, Tanker, and Barge to Other PADDs of Conventional Other Gasoline Blending Components (Thousand Barrels) | ||||||||
| Year | Jan | Feb | Mar | Apr | May | Jun | Jul | Aug | Sep | Oct | Nov | Dec |
|---|---|---|---|---|---|---|---|---|---|---|---|---|
| 2005 | 45 | 45 | 0 | 0 | 0 | 0 | 125 | 110 | 45 | 0 | 50 | |
| 2006 | 91 | 61 | 0 | 290 | 42 | 0 | 0 | 0 | 60 | 0 | 52 | |
| 2007 | 0 | 0 | 0 | 99 | 40 | 50 | 0 | 101 | 0 | |||
| 2008 | 22 | 0 | 0 | 45 | 104 | 0 | 0 | 0 | 0 | |||
| 2009 | 0 | 0 | 42 | 0 | 20 | 20 | 21 | 0 | 0 | 0 | 0 | 0 |
| 2010 | 0 | 21 | 80 | 0 | 80 | 0 | 55 | 60 | 80 | 50 | 0 | 0 |
| 2011 | 101 | 21 | 0 | 108 | 206 | 20 | 126 | 41 | 41 | 66 | 0 | 41 |
| 2012 | 83 | 68 | 88 | 21 | 0 | 0 | 20 | 0 | 0 | 0 | 0 | 30 |
| 2013 | 159 | 106 | 158 | 78 | 226 | 248 | 88 | 139 | 134 | 95 | 132 | 28 |
| 2014 | 104 | 57 | 65 | 66 | 160 | 70 | 140 | 21 | 5 | 10 | 20 | 0 |
| 2015 | 40 | 0 | 0 | 36 | 25 | 45 | 25 | 0 | 0 | 0 | 25 | 0 |
| 2016 | 0 | 0 | 0 | 26 | 25 | 0 | 25 | 68 | 0 | 0 | 0 | 0 |
| 2017 | 0 | 0 | 0 | 0 | 0 | 0 | 0 | 0 | 0 | 0 | 0 | 0 |
| 2018 | 0 | 0 | 0 | 136 | 0 | 175 | 0 | 0 | 0 | 0 | 0 | 0 |
| 2019 | 0 | 0 | 0 | 0 | 0 | 0 | 0 | 0 | 28 | 0 | 0 | 0 |
| 2020 | 0 | 0 | 0 | 0 | 0 | 0 | 0 | 0 | 50 | 0 | 0 | 75 |
| 2021 | 0 | 0 | 0 | 0 | 0 | 0 | 0 | 0 | 0 | 0 | 0 | 0 |
| 2022 | 0 | 0 | 0 | 0 | 0 | 0 | 0 | 0 | 0 | 0 | 0 | 0 |
| 2023 | 0 | 0 | 0 | 0 | 0 | 0 | 0 | 0 | 0 | 0 | 0 | 0 |
| 2024 | 0 | 0 | 0 | 0 | 0 | 0 | ||||||
| - = No Data Reported; -- = Not Applicable; NA = Not Available; W = Withheld to avoid disclosure of individual company data. |
| Release Date: 8/30/2024 |
| Next Release Date: 9/30/2024 |
Referring Pages: