|
Download Data (XLS File) |
|
||||||||
|
||||||||
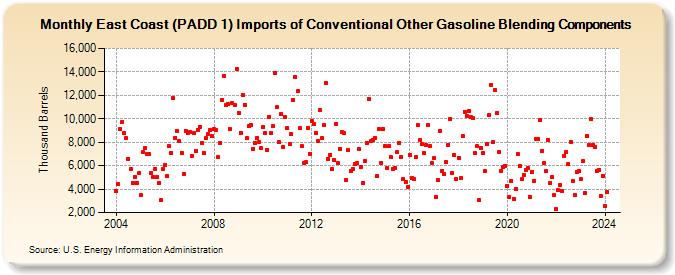
| East Coast (PADD 1) Imports of Conventional Other Gasoline Blending Components (Thousand Barrels) | ||||||||
| Year | Jan | Feb | Mar | Apr | May | Jun | Jul | Aug | Sep | Oct | Nov | Dec |
|---|---|---|---|---|---|---|---|---|---|---|---|---|
| 2004 | 3,838 | 4,419 | 9,125 | 9,747 | 8,752 | 8,335 | 6,599 | 5,727 | 4,523 | 5,073 | 4,542 | 5,340 |
| 2005 | 3,527 | 7,178 | 7,503 | 6,999 | 6,962 | 5,407 | 4,995 | 5,691 | 5,053 | 4,560 | 3,045 | 5,738 |
| 2006 | 6,069 | 5,113 | 7,677 | 7,106 | 11,749 | 8,390 | 8,945 | 8,101 | 7,101 | 5,271 | 8,986 | 8,751 |
| 2007 | 8,854 | 6,853 | 8,786 | 7,288 | 9,076 | 9,318 | 7,938 | 7,044 | 8,340 | 8,722 | 9,045 | 8,512 |
| 2008 | 9,092 | 9,061 | 6,702 | 7,904 | 11,627 | 13,654 | 11,134 | 11,231 | 9,122 | 11,301 | 11,131 | 14,272 |
| 2009 | 10,522 | 8,827 | 12,060 | 11,181 | 8,327 | 9,356 | 9,505 | 7,417 | 7,925 | 8,366 | 8,048 | 7,476 |
| 2010 | 9,311 | 8,787 | 7,348 | 10,182 | 8,792 | 9,356 | 13,932 | 10,986 | 7,991 | 10,404 | 7,621 | 10,119 |
| 2011 | 9,199 | 7,844 | 8,671 | 11,562 | 13,548 | 12,339 | 9,180 | 7,653 | 6,205 | 6,286 | 9,242 | 7,026 |
| 2012 | 9,767 | 9,527 | 8,744 | 8,077 | 10,762 | 8,325 | 9,448 | 13,051 | 6,605 | 6,940 | 5,700 | 6,459 |
| 2013 | 9,559 | 6,199 | 7,447 | 8,830 | 8,770 | 4,793 | 7,310 | 5,522 | 5,723 | 6,113 | 6,268 | 7,436 |
| 2014 | 5,907 | 4,503 | 6,394 | 7,960 | 11,651 | 8,082 | 8,211 | 8,391 | 5,107 | 9,151 | 6,262 | 9,129 |
| 2015 | 7,634 | 5,829 | 7,653 | 6,710 | 5,744 | 5,808 | 7,140 | 7,974 | 6,729 | 4,897 | 4,642 | 4,140 |
| 2016 | 6,938 | 4,962 | 4,823 | 6,703 | 9,429 | 8,148 | 7,809 | 7,069 | 7,766 | 9,446 | 7,665 | 6,184 |
| 2017 | 6,619 | 3,308 | 4,767 | 8,969 | 5,577 | 5,276 | 6,291 | 7,785 | 9,985 | 5,370 | 6,915 | 4,829 |
| 2018 | 6,639 | 4,930 | 8,520 | 10,607 | 10,229 | 10,639 | 10,147 | 10,077 | 7,073 | 7,645 | 3,061 | 7,528 |
| 2019 | 7,050 | 5,554 | 7,819 | 10,293 | 12,901 | 8,010 | 12,442 | 10,519 | 7,179 | 5,578 | 5,877 | 6,006 |
| 2020 | 4,291 | 3,355 | 4,699 | 3,147 | 4,015 | 6,968 | 5,941 | 4,834 | 5,241 | 5,651 | 5,769 | 3,343 |
| 2021 | 5,459 | 4,704 | 8,298 | 8,262 | 9,879 | 7,275 | 6,244 | 5,512 | 8,147 | 4,526 | 5,044 | 3,498 |
| 2022 | 2,270 | 3,896 | 4,365 | 3,844 | 6,829 | 7,202 | 6,102 | 8,057 | 4,660 | 3,510 | 5,454 | 5,536 |
| 2023 | 4,823 | 6,395 | 3,661 | 8,487 | 7,768 | 9,938 | 7,798 | 7,626 | 5,579 | 5,639 | 3,408 | 5,160 |
| 2024 | 2,531 | |||||||||||
| - = No Data Reported; -- = Not Applicable; NA = Not Available; W = Withheld to avoid disclosure of individual company data. |
| Release Date: 3/29/2024 |
| Next Release Date: 4/30/2024 |