|
Download Data (XLS File) |
|
||||||||
|
||||||||
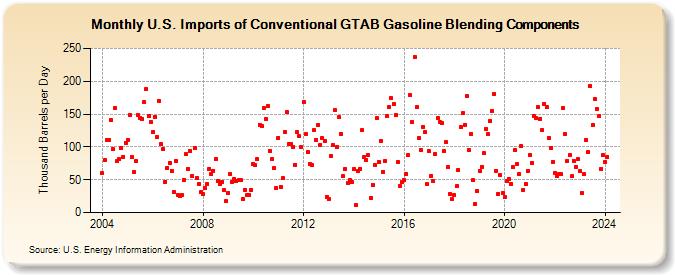
| U.S. Imports of Conventional GTAB Gasoline Blending Components (Thousand Barrels per Day) | ||||||||
| Year | Jan | Feb | Mar | Apr | May | Jun | Jul | Aug | Sep | Oct | Nov | Dec |
|---|---|---|---|---|---|---|---|---|---|---|---|---|
| 2004 | 60 | 80 | 111 | 111 | 141 | 97 | 159 | 79 | 81 | 98 | 85 | 106 |
| 2005 | 111 | 148 | 84 | 62 | 79 | 148 | 144 | 143 | 168 | 188 | 147 | 138 |
| 2006 | 122 | 146 | 115 | 170 | 104 | 97 | 47 | 68 | 76 | 64 | 32 | 79 |
| 2007 | 26 | 25 | 27 | 50 | 89 | 67 | 94 | 55 | 98 | 53 | 44 | 31 |
| 2008 | 28 | 37 | 44 | 67 | 59 | 64 | 81 | 48 | 43 | 47 | 34 | 17 |
| 2009 | 30 | 59 | 47 | 51 | 48 | 49 | 49 | 20 | 35 | 26 | 26 | 35 |
| 2010 | 74 | 72 | 81 | 134 | 132 | 159 | 143 | 162 | 94 | 81 | 68 | 38 |
| 2011 | 114 | 39 | 52 | 123 | 153 | 105 | 105 | 100 | 73 | 122 | 116 | 100 |
| 2012 | 169 | 119 | 92 | 74 | 73 | 125 | 111 | 133 | 103 | 113 | 109 | 24 |
| 2013 | 20 | 86 | 103 | 156 | 100 | 145 | 120 | 55 | 67 | 45 | 49 | 46 |
| 2014 | 66 | 11 | 64 | 67 | 125 | 84 | 80 | 87 | 22 | 42 | 73 | 144 |
| 2015 | 77 | 109 | 62 | 79 | 147 | 161 | 174 | 165 | 149 | 77 | 41 | 46 |
| 2016 | 49 | 59 | 87 | 179 | 138 | 237 | 160 | 113 | 95 | 131 | 122 | 43 |
| 2017 | 93 | 56 | 48 | 89 | 144 | 138 | 136 | 93 | 107 | 69 | 29 | 20 |
| 2018 | 27 | 40 | 65 | 130 | 151 | 134 | 177 | 95 | 120 | 49 | 13 | 33 |
| 2019 | 64 | 70 | 90 | 128 | 119 | 140 | 155 | 181 | 64 | 29 | 57 | 30 |
| 2020 | 24 | 48 | 51 | 44 | 69 | 95 | 74 | 58 | 101 | 35 | 43 | 64 |
| 2021 | 88 | 76 | 147 | 144 | 160 | 143 | 126 | 165 | 160 | 114 | 99 | 77 |
| 2022 | 60 | 55 | 58 | 58 | 159 | 119 | 79 | 87 | 55 | 79 | 70 | 81 |
| 2023 | 63 | 30 | 58 | 111 | 92 | 193 | 133 | 173 | 158 | 147 | 67 | 87 |
| 2024 | 77 | |||||||||||
| - = No Data Reported; -- = Not Applicable; NA = Not Available; W = Withheld to avoid disclosure of individual company data. |
| Release Date: 3/29/2024 |
| Next Release Date: 4/30/2024 |