|
Download Data (XLS File) |
|
||||||||
|
||||||||
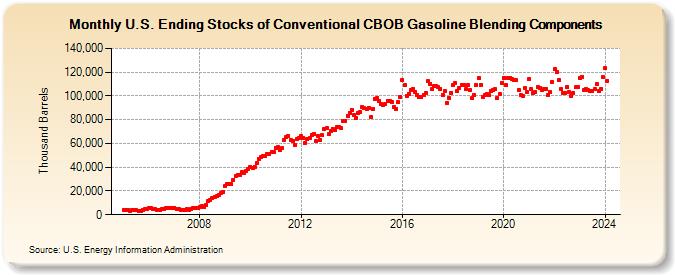
| U.S. Ending Stocks of Conventional CBOB Gasoline Blending Components (Thousand Barrels) | ||||||||
| Year | Jan | Feb | Mar | Apr | May | Jun | Jul | Aug | Sep | Oct | Nov | Dec |
|---|---|---|---|---|---|---|---|---|---|---|---|---|
| 2005 | 4,066 | 3,989 | 3,779 | 3,514 | 3,679 | 3,843 | 3,662 | 3,421 | 3,435 | 4,197 | 4,789 | 4,705 |
| 2006 | 5,549 | 5,324 | 4,913 | 4,547 | 4,344 | 3,832 | 4,708 | 4,901 | 5,273 | 5,800 | 5,538 | 5,867 |
| 2007 | 5,877 | 4,881 | 4,948 | 4,333 | 4,147 | 4,013 | 4,609 | 4,342 | 4,963 | 5,261 | 5,532 | 5,620 |
| 2008 | 6,211 | 6,939 | 6,500 | 8,259 | 11,681 | 12,784 | 13,858 | 15,095 | 15,335 | 16,775 | 17,938 | 19,380 |
| 2009 | 24,491 | 25,775 | 26,180 | 25,617 | 29,282 | 32,465 | 33,489 | 33,401 | 35,824 | 35,224 | 36,812 | 38,817 |
| 2010 | 40,109 | 39,595 | 40,326 | 43,216 | 46,927 | 48,215 | 49,310 | 49,479 | 51,280 | 51,353 | 52,486 | 52,586 |
| 2011 | 56,255 | 56,723 | 54,529 | 56,097 | 63,023 | 65,145 | 65,940 | 62,723 | 61,936 | 58,641 | 63,625 | 64,830 |
| 2012 | 66,212 | 64,884 | 60,712 | 63,537 | 64,287 | 67,361 | 67,791 | 62,206 | 66,377 | 62,768 | 66,679 | 72,261 |
| 2013 | 72,744 | 67,761 | 70,443 | 72,410 | 71,018 | 73,723 | 73,852 | 72,987 | 78,639 | 79,165 | 83,420 | 85,970 |
| 2014 | 88,360 | 83,981 | 81,349 | 85,261 | 86,645 | 90,746 | 89,488 | 89,036 | 89,848 | 82,295 | 88,766 | 97,709 |
| 2015 | 98,357 | 96,003 | 92,994 | 92,429 | 93,086 | 95,993 | 95,619 | 95,180 | 90,825 | 89,218 | 94,636 | 99,348 |
| 2016 | 113,249 | 108,807 | 100,146 | 102,022 | 105,309 | 106,176 | 103,576 | 100,604 | 99,154 | 98,669 | 100,442 | 102,641 |
| 2017 | 112,165 | 110,324 | 105,572 | 108,017 | 108,695 | 107,139 | 105,901 | 100,741 | 103,912 | 94,421 | 98,636 | 102,652 |
| 2018 | 109,150 | 110,744 | 103,924 | 107,030 | 109,326 | 109,073 | 105,565 | 109,108 | 105,010 | 98,233 | 100,642 | 109,288 |
| 2019 | 114,942 | 109,405 | 99,444 | 100,474 | 101,936 | 100,443 | 103,939 | 105,160 | 105,463 | 98,174 | 101,477 | 110,920 |
| 2020 | 115,352 | 108,855 | 115,204 | 115,410 | 113,997 | 113,361 | 113,152 | 104,804 | 100,914 | 99,950 | 106,881 | 103,048 |
| 2021 | 113,937 | 105,643 | 102,113 | 103,280 | 107,414 | 106,320 | 105,009 | 106,059 | 106,147 | 100,945 | 103,251 | 111,840 |
| 2022 | 122,386 | 120,184 | 113,061 | 105,727 | 102,834 | 102,224 | 107,522 | 103,085 | 99,860 | 102,849 | 107,094 | 107,234 |
| 2023 | 115,217 | 116,234 | 104,996 | 105,895 | 104,718 | 104,535 | 104,278 | 105,812 | 109,634 | 104,266 | 106,143 | 115,732 |
| 2024 | 123,249 | |||||||||||
| - = No Data Reported; -- = Not Applicable; NA = Not Available; W = Withheld to avoid disclosure of individual company data. |
| Release Date: 3/29/2024 |
| Next Release Date: 4/30/2024 |