|
Download Data (XLS File) |
|
||||||||
|
||||||||
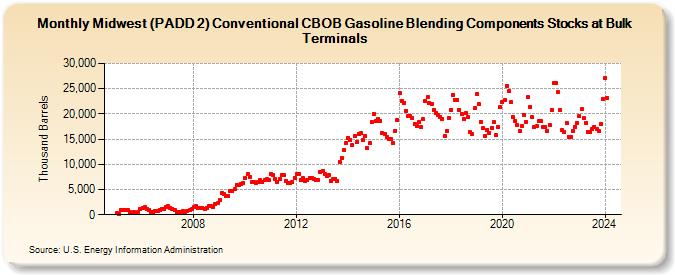
| Midwest (PADD 2) Conventional CBOB Gasoline Blending Components Stocks at Bulk Terminals (Thousand Barrels) | ||||||||
| Year | Jan | Feb | Mar | Apr | May | Jun | Jul | Aug | Sep | Oct | Nov | Dec |
|---|---|---|---|---|---|---|---|---|---|---|---|---|
| 2005 | 251 | 174 | 908 | 1,013 | 881 | 929 | 469 | 403 | 505 | 423 | 590 | 1,120 |
| 2006 | 1,320 | 1,447 | 1,102 | 996 | 604 | 565 | 666 | 649 | 961 | 1,162 | 1,088 | 1,446 |
| 2007 | 1,641 | 1,319 | 1,206 | 852 | 555 | 500 | 497 | 644 | 601 | 651 | 853 | 1,065 |
| 2008 | 1,532 | 1,705 | 1,279 | 1,329 | 1,343 | 1,226 | 1,431 | 1,658 | 1,636 | 1,623 | 2,089 | 2,240 |
| 2009 | 2,891 | 4,345 | 4,114 | 3,640 | 3,736 | 4,772 | 4,776 | 5,002 | 5,957 | 5,960 | 6,176 | 6,350 |
| 2010 | 7,195 | 7,982 | 7,392 | 6,450 | 6,481 | 6,349 | 6,463 | 6,821 | 6,402 | 6,933 | 6,994 | 6,859 |
| 2011 | 8,046 | 7,887 | 7,100 | 6,555 | 7,014 | 7,788 | 7,972 | 6,593 | 6,320 | 6,319 | 6,447 | 7,340 |
| 2012 | 8,094 | 8,147 | 6,849 | 7,257 | 6,757 | 6,840 | 7,320 | 7,211 | 7,073 | 6,954 | 6,849 | 8,532 |
| 2013 | 8,582 | 8,043 | 7,737 | 7,844 | 6,743 | 7,008 | 7,105 | 6,650 | 10,468 | 11,286 | 12,909 | 14,275 |
| 2014 | 15,253 | 14,801 | 13,764 | 15,546 | 14,438 | 16,093 | 16,148 | 14,819 | 15,546 | 13,175 | 14,210 | 18,490 |
| 2015 | 20,001 | 18,673 | 19,034 | 18,665 | 16,254 | 16,055 | 15,496 | 15,074 | 14,955 | 14,230 | 16,704 | 18,801 |
| 2016 | 24,074 | 22,636 | 22,125 | 20,615 | 19,530 | 19,494 | 19,206 | 18,020 | 17,649 | 18,294 | 17,342 | 18,889 |
| 2017 | 22,567 | 23,297 | 22,141 | 21,946 | 20,738 | 20,118 | 19,856 | 19,405 | 19,025 | 15,650 | 16,638 | 19,179 |
| 2018 | 20,796 | 23,753 | 22,789 | 22,843 | 20,839 | 20,018 | 18,956 | 20,081 | 19,371 | 16,349 | 15,930 | 21,112 |
| 2019 | 23,872 | 21,887 | 18,474 | 17,126 | 15,617 | 16,887 | 16,290 | 17,218 | 18,423 | 15,784 | 17,460 | 21,310 |
| 2020 | 22,331 | 22,699 | 25,542 | 24,540 | 22,265 | 19,354 | 18,600 | 17,784 | 16,523 | 17,630 | 19,872 | 18,485 |
| 2021 | 23,299 | 21,445 | 19,327 | 17,312 | 17,501 | 18,515 | 18,512 | 17,368 | 17,458 | 16,564 | 17,809 | 20,738 |
| 2022 | 26,165 | 26,044 | 24,255 | 20,749 | 16,717 | 16,425 | 18,196 | 15,512 | 15,423 | 16,572 | 17,467 | 18,269 |
| 2023 | 19,561 | 20,898 | 19,122 | 18,196 | 16,505 | 16,458 | 17,021 | 17,479 | 17,035 | 16,575 | 18,048 | 23,048 |
| 2024 | 27,035 | |||||||||||
| - = No Data Reported; -- = Not Applicable; NA = Not Available; W = Withheld to avoid disclosure of individual company data. |
| Release Date: 3/29/2024 |
| Next Release Date: 4/30/2024 |