|
Download Data (XLS File) |
|
||||||||
|
||||||||
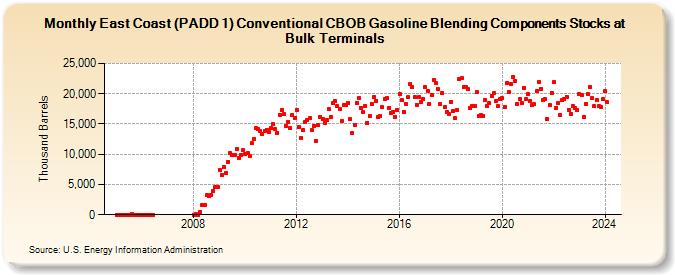
| East Coast (PADD 1) Conventional CBOB Gasoline Blending Components Stocks at Bulk Terminals (Thousand Barrels) | ||||||||
| Year | Jan | Feb | Mar | Apr | May | Jun | Jul | Aug | Sep | Oct | Nov | Dec |
|---|---|---|---|---|---|---|---|---|---|---|---|---|
| 2005 | 25 | 30 | 10 | 19 | 27 | 21 | 16 | 146 | 14 | 10 | 17 | 13 |
| 2006 | 35 | 24 | 9 | 7 | 23 | 9 | ||||||
| 2008 | 31 | 57 | 25 | 409 | 1,625 | 1,669 | 3,205 | 3,060 | 3,304 | 3,957 | 4,529 | 4,578 |
| 2009 | 7,418 | 6,607 | 7,912 | 6,974 | 8,727 | 10,136 | 9,800 | 9,865 | 10,782 | 9,415 | 9,951 | 10,706 |
| 2010 | 10,021 | 10,202 | 9,763 | 11,810 | 12,559 | 14,258 | 14,196 | 13,782 | 13,353 | 13,827 | 14,066 | 13,693 |
| 2011 | 14,314 | 14,930 | 14,156 | 13,588 | 16,543 | 17,308 | 16,643 | 14,746 | 15,361 | 14,318 | 16,420 | 15,944 |
| 2012 | 17,352 | 14,582 | 12,717 | 13,970 | 15,354 | 15,713 | 15,938 | 13,938 | 14,745 | 12,191 | 14,856 | 16,203 |
| 2013 | 15,754 | 15,242 | 15,582 | 17,422 | 16,150 | 18,404 | 18,740 | 17,953 | 17,522 | 15,507 | 18,119 | 18,145 |
| 2014 | 18,462 | 15,770 | 13,530 | 14,877 | 18,457 | 19,296 | 17,660 | 16,912 | 18,042 | 15,219 | 16,370 | 18,376 |
| 2015 | 19,499 | 18,863 | 16,108 | 16,381 | 17,756 | 19,058 | 19,263 | 17,695 | 16,894 | 17,048 | 16,232 | 17,344 |
| 2016 | 19,958 | 18,918 | 16,990 | 18,346 | 19,400 | 21,649 | 21,043 | 19,396 | 18,198 | 19,396 | 18,688 | 19,064 |
| 2017 | 21,142 | 20,383 | 18,310 | 19,763 | 22,325 | 21,699 | 20,739 | 18,248 | 20,175 | 17,842 | 17,015 | 16,724 |
| 2018 | 18,645 | 17,131 | 15,912 | 17,353 | 22,509 | 22,581 | 21,065 | 21,099 | 20,707 | 17,641 | 17,987 | 18,008 |
| 2019 | 20,215 | 16,284 | 16,511 | 16,383 | 18,917 | 17,907 | 18,413 | 19,625 | 20,039 | 18,835 | 17,911 | 19,055 |
| 2020 | 19,236 | 17,784 | 21,715 | 20,228 | 21,616 | 22,840 | 22,120 | 18,273 | 19,157 | 18,543 | 21,024 | 19,046 |
| 2021 | 19,925 | 18,851 | 18,056 | 18,237 | 20,370 | 21,956 | 20,860 | 19,045 | 19,080 | 15,778 | 18,106 | 20,195 |
| 2022 | 21,888 | 17,670 | 18,448 | 16,401 | 18,889 | 19,103 | 19,520 | 17,328 | 16,682 | 18,037 | 17,618 | 17,301 |
| 2023 | 19,822 | 19,980 | 16,135 | 18,366 | 19,968 | 20,996 | 19,274 | 17,892 | 19,010 | 17,905 | 17,866 | 18,998 |
| 2024 | 20,433 | 18,585 | 17,204 | 17,627 | 18,304 | 20,988 | ||||||
| - = No Data Reported; -- = Not Applicable; NA = Not Available; W = Withheld to avoid disclosure of individual company data. |
| Release Date: 8/30/2024 |
| Next Release Date: 9/30/2024 |