|
Download Data (XLS File) |
|
||||||||
|
||||||||
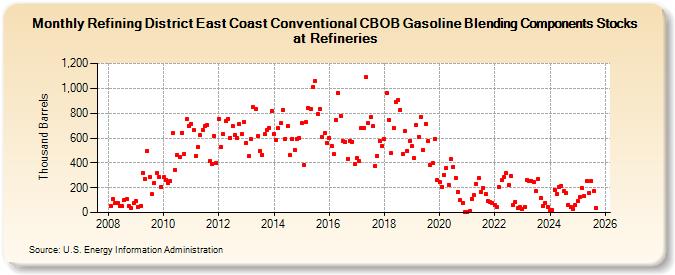
| Refining District East Coast Conventional CBOB Gasoline Blending Components Stocks at Refineries (Thousand Barrels) | ||||||||
| Year | Jan | Feb | Mar | Apr | May | Jun | Jul | Aug | Sep | Oct | Nov | Dec |
|---|---|---|---|---|---|---|---|---|---|---|---|---|
| 2008 | 54 | 108 | 73 | 75 | 56 | 52 | 102 | 108 | 50 | 37 | 75 | |
| 2009 | 93 | 45 | 51 | 322 | 274 | 499 | 290 | 147 | 239 | 320 | 289 | 208 |
| 2010 | 283 | 263 | 241 | 252 | 638 | 343 | 462 | 449 | 644 | 474 | 750 | 697 |
| 2011 | 715 | 664 | 455 | 528 | 621 | 665 | 693 | 703 | 415 | 387 | 618 | 400 |
| 2012 | 756 | 528 | 632 | 737 | 757 | 604 | 697 | 625 | 602 | 712 | 631 | 729 |
| 2013 | 561 | 453 | 592 | 850 | 837 | 618 | 495 | 467 | 632 | 664 | 684 | 816 |
| 2014 | 633 | 588 | 678 | 718 | 828 | 595 | 693 | 463 | 596 | 507 | 596 | 601 |
| 2015 | 719 | 383 | 725 | 843 | 830 | 1,011 | 1,059 | 795 | 834 | 610 | 639 | 557 |
| 2016 | 604 | 538 | 468 | 749 | 966 | 780 | 573 | 568 | 434 | 577 | 570 | 392 |
| 2017 | 439 | 413 | 677 | 677 | 1,088 | 721 | 766 | 693 | 378 | 458 | 575 | 537 |
| 2018 | 591 | 961 | 747 | 478 | 683 | 891 | 905 | 829 | 475 | 655 | 497 | 580 |
| 2019 | 532 | 438 | 706 | 611 | 770 | 505 | 716 | 577 | 386 | 397 | 593 | 263 |
| 2020 | 242 | 208 | 305 | 362 | 225 | 429 | 370 | 282 | 169 | 99 | 79 | 1 |
| 2021 | 1 | 11 | 110 | 138 | 231 | 275 | 167 | 200 | 147 | 91 | 81 | 78 |
| 2022 | 60 | 41 | 204 | 260 | 285 | 319 | 219 | 295 | 58 | 87 | 35 | 43 |
| 2023 | 28 | 48 | 266 | 252 | 257 | 244 | 170 | 271 | 121 | 51 | 79 | 48 |
| 2024 | 15 | 20 | 185 | 151 | 203 | 216 | ||||||
| - = No Data Reported; -- = Not Applicable; NA = Not Available; W = Withheld to avoid disclosure of individual company data. |
| Release Date: 8/30/2024 |
| Next Release Date: 9/30/2024 |