|
Download Data (XLS File) |
|
||||||||
|
||||||||
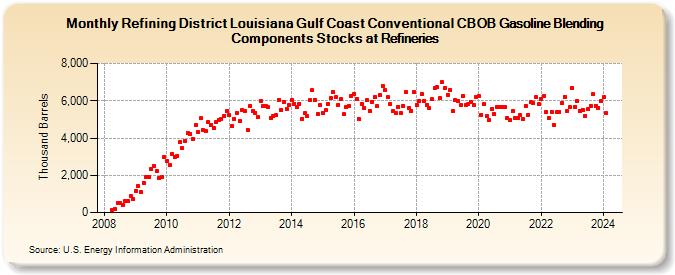
| Refining District Louisiana Gulf Coast Conventional CBOB Gasoline Blending Components Stocks at Refineries (Thousand Barrels) | ||||||||
| Year | Jan | Feb | Mar | Apr | May | Jun | Jul | Aug | Sep | Oct | Nov | Dec |
|---|---|---|---|---|---|---|---|---|---|---|---|---|
| 2008 | 125 | 204 | 532 | 509 | 426 | 631 | 594 | 893 | 740 | |||
| 2009 | 1,166 | 1,437 | 1,095 | 1,607 | 1,931 | 1,931 | 2,336 | 2,516 | 2,238 | 1,840 | 1,904 | 2,983 |
| 2010 | 2,758 | 2,546 | 3,163 | 2,983 | 3,047 | 3,769 | 3,439 | 3,854 | 4,296 | 4,238 | 3,965 | 4,709 |
| 2011 | 4,306 | 5,051 | 4,425 | 4,402 | 4,847 | 4,690 | 4,517 | 4,862 | 4,972 | 5,023 | 5,199 | 5,430 |
| 2012 | 5,213 | 4,645 | 5,024 | 5,338 | 4,903 | 5,516 | 5,470 | 4,436 | 5,734 | 5,438 | 5,367 | 5,137 |
| 2013 | 6,011 | 5,700 | 5,694 | 5,639 | 5,081 | 5,183 | 5,216 | 6,035 | 5,512 | 5,953 | 5,576 | 5,770 |
| 2014 | 6,045 | 5,850 | 5,682 | 5,832 | 5,032 | 5,320 | 5,163 | 6,015 | 6,555 | 6,032 | 5,313 | 5,749 |
| 2015 | 5,333 | 5,490 | 5,841 | 6,128 | 6,465 | 6,181 | 5,786 | 6,088 | 5,274 | 5,670 | 5,706 | 6,245 |
| 2016 | 6,350 | 6,120 | 5,003 | 5,826 | 5,585 | 6,017 | 5,473 | 5,948 | 6,191 | 5,704 | 6,285 | 6,799 |
| 2017 | 6,558 | 6,177 | 5,826 | 5,431 | 5,354 | 5,691 | 5,342 | 5,741 | 6,449 | 5,616 | 5,460 | 6,462 |
| 2018 | 5,777 | 5,976 | 6,341 | 6,005 | 5,764 | 5,623 | 6,068 | 6,707 | 6,718 | 6,129 | 6,988 | 6,699 |
| 2019 | 6,311 | 6,573 | 5,429 | 6,034 | 5,987 | 5,764 | 6,271 | 5,797 | 5,823 | 5,954 | 5,767 | 6,216 |
| 2020 | 6,241 | 5,243 | 5,831 | 5,175 | 4,983 | 5,584 | 5,283 | 5,651 | 5,658 | 5,640 | 5,649 | 5,064 |
| 2021 | 4,986 | 5,425 | 5,098 | 5,070 | 5,223 | 5,015 | 5,738 | 5,241 | 5,914 | 5,884 | 6,181 | 5,800 |
| 2022 | 6,111 | 6,278 | 5,396 | 5,083 | 5,415 | 4,712 | 5,391 | 5,423 | 5,880 | 6,217 | 5,443 | 5,645 |
| 2023 | 6,690 | 5,675 | 5,969 | 5,465 | 5,527 | 5,179 | 5,539 | 5,731 | 6,346 | 5,739 | 5,632 | 5,971 |
| 2024 | 6,191 | 5,321 | 5,041 | 5,233 | 5,178 | 4,238 | ||||||
| - = No Data Reported; -- = Not Applicable; NA = Not Available; W = Withheld to avoid disclosure of individual company data. |
| Release Date: 8/30/2024 |
| Next Release Date: 9/30/2024 |