|
Download Data (XLS File) |
|
||||||||
|
||||||||
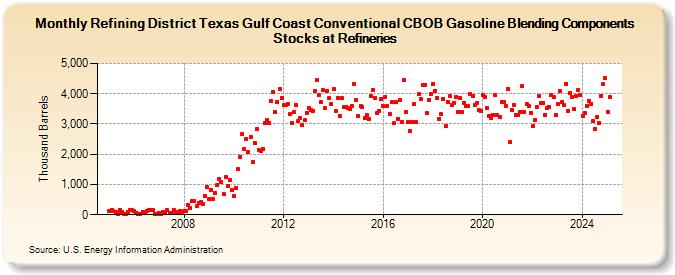
| Refining District Texas Gulf Coast Conventional CBOB Gasoline Blending Components Stocks at Refineries (Thousand Barrels) | ||||||||
| Year | Jan | Feb | Mar | Apr | May | Jun | Jul | Aug | Sep | Oct | Nov | Dec |
|---|---|---|---|---|---|---|---|---|---|---|---|---|
| 2005 | 131 | 161 | 111 | 89 | 15 | 159 | 96 | 13 | 19 | 79 | 154 | 146 |
| 2006 | 114 | 70 | 37 | 40 | 93 | 73 | 133 | 141 | 149 | 145 | 40 | 25 |
| 2007 | 51 | 18 | 90 | 68 | 156 | 65 | 71 | 149 | 53 | 101 | 122 | 76 |
| 2008 | 129 | 111 | 312 | 210 | 448 | 437 | 272 | 379 | 408 | 353 | 610 | 914 |
| 2009 | 507 | 821 | 507 | 714 | 983 | 1,168 | 1,080 | 701 | 1,248 | 934 | 1,161 | 807 |
| 2010 | 617 | 899 | 1,511 | 1,916 | 2,658 | 2,169 | 2,488 | 2,066 | 2,572 | 1,738 | 2,377 | 2,839 |
| 2011 | 2,145 | 2,101 | 2,188 | 3,019 | 3,144 | 3,031 | 3,748 | 4,053 | 3,387 | 3,738 | 4,155 | 3,866 |
| 2012 | 3,617 | 3,641 | 3,651 | 3,317 | 3,048 | 3,402 | 3,641 | 3,086 | 3,191 | 2,958 | 3,118 | 3,373 |
| 2013 | 3,525 | 3,453 | 3,427 | 4,091 | 4,443 | 3,951 | 3,720 | 4,121 | 3,527 | 4,103 | 3,846 | 3,662 |
| 2014 | 4,151 | 3,436 | 3,869 | 3,264 | 3,847 | 3,559 | 3,574 | 3,523 | 3,502 | 3,600 | 4,308 | 3,784 |
| 2015 | 3,261 | 3,606 | 3,558 | 3,192 | 3,297 | 3,149 | 3,933 | 4,131 | 3,866 | 3,350 | 3,439 | 3,828 |
| 2016 | 3,579 | 3,897 | 3,582 | 3,342 | 3,713 | 3,017 | 3,715 | 3,174 | 3,794 | 3,070 | 4,452 | 3,412 |
| 2017 | 3,080 | 2,777 | 3,060 | 3,661 | 3,065 | 3,988 | 3,828 | 4,288 | 4,280 | 3,368 | 3,803 | 3,986 |
| 2018 | 4,326 | 4,087 | 3,851 | 3,173 | 3,324 | 3,834 | 2,945 | 3,731 | 3,911 | 3,633 | 3,707 | 3,889 |
| 2019 | 3,411 | 3,852 | 3,396 | 3,708 | 3,580 | 3,602 | 3,987 | 3,909 | 3,632 | 3,697 | 3,450 | 3,425 |
| 2020 | 3,954 | 3,882 | 3,523 | 3,273 | 3,207 | 3,293 | 3,958 | 3,282 | 3,227 | 3,711 | 3,719 | 3,598 |
| 2021 | 4,162 | 2,399 | 3,460 | 3,638 | 3,282 | 3,306 | 3,412 | 4,258 | 3,385 | 3,650 | 3,604 | 3,369 |
| 2022 | 2,919 | 3,136 | 3,557 | 3,911 | 3,687 | 3,680 | 3,306 | 3,512 | 3,558 | 3,965 | 3,885 | 3,297 |
| 2023 | 3,651 | 4,079 | 3,835 | 3,613 | 4,336 | 3,445 | 4,020 | 3,879 | 3,480 | 3,935 | 4,124 | 3,945 |
| 2024 | 3,277 | |||||||||||
| - = No Data Reported; -- = Not Applicable; NA = Not Available; W = Withheld to avoid disclosure of individual company data. |
| Release Date: 3/29/2024 |
| Next Release Date: 4/30/2024 |