|
Download Data (XLS File) |
|
||||||||
|
||||||||
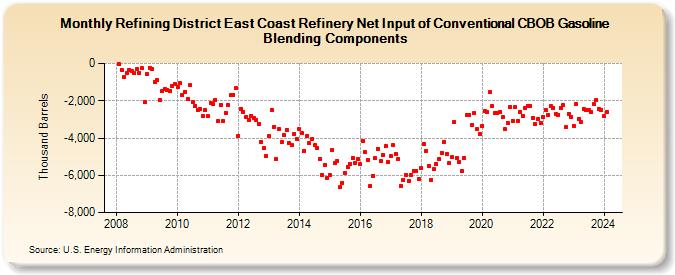
| Refining District East Coast Refinery Net Input of Conventional CBOB Gasoline Blending Components (Thousand Barrels) | ||||||||
| Year | Jan | Feb | Mar | Apr | May | Jun | Jul | Aug | Sep | Oct | Nov | Dec |
|---|---|---|---|---|---|---|---|---|---|---|---|---|
| 2008 | -54 | -324 | -725 | -508 | -323 | -402 | -510 | -297 | -487 | -263 | -2,082 | |
| 2009 | -584 | -224 | -287 | -988 | -890 | -1,941 | -1,491 | -1,377 | -1,403 | -1,470 | -1,209 | -1,117 |
| 2010 | -1,247 | -1,073 | -1,681 | -1,512 | -1,888 | -1,178 | -2,076 | -2,263 | -2,491 | -2,441 | -2,817 | -2,490 |
| 2011 | -2,835 | -2,096 | -2,163 | -1,955 | -3,087 | -2,214 | -3,100 | -2,638 | -2,241 | -1,709 | -1,668 | -1,327 |
| 2012 | -3,870 | -2,434 | -2,598 | -2,871 | -3,023 | -2,826 | -2,937 | -3,013 | -3,234 | -4,208 | -4,545 | -4,939 |
| 2013 | -3,896 | -2,483 | -3,399 | -5,146 | -3,500 | -4,226 | -3,855 | -3,557 | -4,270 | -4,373 | -3,763 | -4,043 |
| 2014 | -3,528 | -3,753 | -4,701 | -3,881 | -4,276 | -4,032 | -4,394 | -4,510 | -5,131 | -5,982 | -5,431 | -6,138 |
| 2015 | -5,996 | -4,619 | -5,354 | -5,210 | -6,648 | -6,392 | -5,854 | -5,555 | -5,395 | -5,056 | -5,315 | -5,127 |
| 2016 | -5,409 | -4,150 | -4,757 | -5,157 | -6,570 | -6,022 | -5,098 | -4,572 | -5,211 | -4,909 | -4,418 | -5,263 |
| 2017 | -4,957 | -4,400 | -4,865 | -5,123 | -6,561 | -6,250 | -5,958 | -6,304 | -5,989 | -5,757 | -5,753 | -6,179 |
| 2018 | -5,627 | -4,318 | -4,679 | -5,504 | -6,231 | -5,688 | -5,416 | -5,148 | -4,780 | -4,188 | -4,852 | -5,366 |
| 2019 | -5,042 | -3,125 | -5,059 | -5,280 | -5,790 | -5,057 | -2,782 | -2,743 | -3,278 | -2,654 | -3,521 | -3,767 |
| 2020 | -3,353 | -2,549 | -2,630 | -1,547 | -2,302 | -2,664 | -2,654 | -2,600 | -2,898 | -3,528 | -3,188 | -2,312 |
| 2021 | -3,063 | -2,344 | -3,060 | -2,585 | -2,800 | -2,389 | -2,281 | -2,281 | -2,901 | -3,271 | -2,954 | -3,169 |
| 2022 | -2,850 | -2,477 | -2,766 | -2,303 | -2,376 | -2,701 | -2,760 | -2,365 | -2,230 | -3,433 | -2,689 | -2,871 |
| 2023 | -3,340 | -2,166 | -2,961 | -3,156 | -2,427 | -2,489 | -2,518 | -2,593 | -2,151 | -1,965 | -2,427 | -2,475 |
| 2024 | -2,838 | |||||||||||
| - = No Data Reported; -- = Not Applicable; NA = Not Available; W = Withheld to avoid disclosure of individual company data. |
| Release Date: 3/29/2024 |
| Next Release Date: 4/30/2024 |