|
Download Data (XLS File) |
|
||||||||
|
||||||||
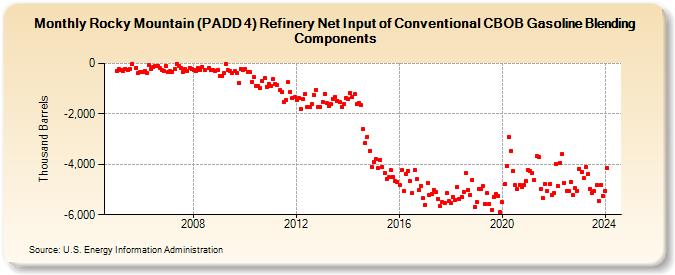
| Rocky Mountain (PADD 4) Refinery Net Input of Conventional CBOB Gasoline Blending Components (Thousand Barrels) | ||||||||
| Year | Jan | Feb | Mar | Apr | May | Jun | Jul | Aug | Sep | Oct | Nov | Dec |
|---|---|---|---|---|---|---|---|---|---|---|---|---|
| 2005 | -281 | -235 | -268 | -293 | -214 | -255 | -225 | -36 | -160 | -369 | -330 | |
| 2006 | -350 | -281 | -363 | -66 | -200 | -138 | -95 | -86 | -180 | -276 | -315 | -103 |
| 2007 | -330 | -305 | -350 | -216 | -17 | -92 | -185 | -328 | -225 | -291 | -166 | -218 |
| 2008 | -261 | -281 | -166 | -269 | -130 | -265 | -163 | -278 | -250 | -284 | -265 | |
| 2009 | -495 | -480 | -376 | -29 | -277 | -311 | -379 | -317 | -368 | -763 | -207 | -268 |
| 2010 | -237 | -332 | -346 | -727 | -550 | -881 | -890 | -965 | -704 | -590 | -920 | -800 |
| 2011 | -875 | -624 | -802 | -862 | -1,066 | -1,121 | -1,519 | -1,433 | -742 | -1,116 | -1,379 | -1,314 |
| 2012 | -1,466 | -1,387 | -1,812 | -1,413 | -1,206 | -1,744 | -1,738 | -1,623 | -1,235 | -1,045 | -1,714 | -1,728 |
| 2013 | -1,515 | -1,208 | -1,583 | -1,672 | -1,621 | -1,400 | -1,314 | -1,485 | -1,530 | -1,713 | -1,604 | -1,366 |
| 2014 | -1,398 | -1,175 | -1,341 | -1,222 | -1,620 | -1,572 | -1,653 | -2,618 | -3,158 | -2,904 | -3,471 | -4,103 |
| 2015 | -3,895 | -3,804 | -4,154 | -3,822 | -4,099 | -4,349 | -4,569 | -4,516 | -4,239 | -4,488 | -4,657 | -4,701 |
| 2016 | -4,837 | -4,242 | -5,076 | -4,371 | -4,258 | -4,676 | -5,147 | -4,233 | -4,601 | -5,038 | -4,853 | -5,355 |
| 2017 | -5,597 | -4,731 | -5,227 | -5,178 | -5,019 | -5,116 | -5,366 | -5,657 | -5,498 | -5,517 | -5,148 | -5,467 |
| 2018 | -5,544 | -5,288 | -5,399 | -4,910 | -5,376 | -5,286 | -5,093 | -4,356 | -5,013 | -5,210 | -4,612 | -5,693 |
| 2019 | -5,490 | -4,964 | -4,974 | -4,857 | -5,562 | -5,150 | -5,567 | -5,805 | -5,302 | -5,184 | -5,249 | -5,909 |
| 2020 | -5,513 | -4,798 | -4,085 | -2,920 | -3,454 | -4,279 | -4,834 | -4,994 | -4,806 | -4,896 | -4,823 | -4,664 |
| 2021 | -4,213 | -4,266 | -4,337 | -4,608 | -3,682 | -3,723 | -4,978 | -5,344 | -4,767 | -5,050 | -4,779 | -5,209 |
| 2022 | -5,146 | -3,977 | -4,854 | -3,941 | -3,607 | -4,730 | -5,040 | -5,055 | -4,710 | -5,226 | -4,954 | -5,045 |
| 2023 | -4,174 | -4,319 | -4,552 | -4,117 | -4,398 | -4,975 | -5,126 | -5,070 | -4,839 | -5,442 | -4,814 | -5,238 |
| 2024 | -5,052 | |||||||||||
| - = No Data Reported; -- = Not Applicable; NA = Not Available; W = Withheld to avoid disclosure of individual company data. |
| Release Date: 3/29/2024 |
| Next Release Date: 4/30/2024 |