|
Download Data (XLS File) |
|
||||||||
|
||||||||
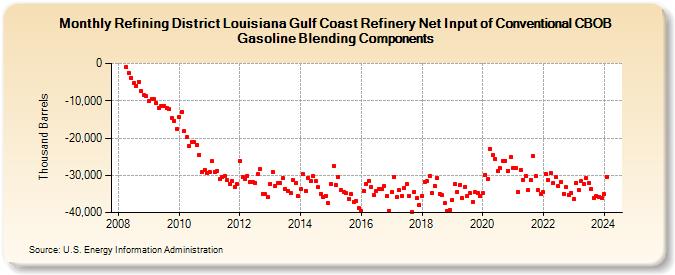
| Refining District Louisiana Gulf Coast Refinery Net Input of Conventional CBOB Gasoline Blending Components (Thousand Barrels) | ||||||||
| Year | Jan | Feb | Mar | Apr | May | Jun | Jul | Aug | Sep | Oct | Nov | Dec |
|---|---|---|---|---|---|---|---|---|---|---|---|---|
| 2008 | -1,044 | -2,445 | -3,787 | -5,267 | -6,040 | -4,902 | -7,456 | -8,489 | -8,835 | |||
| 2009 | -10,080 | -9,400 | -9,589 | -10,721 | -11,866 | -11,494 | -11,302 | -11,975 | -12,294 | -14,623 | -15,354 | -17,563 |
| 2010 | -14,379 | -12,889 | -18,237 | -19,776 | -22,085 | -21,056 | -21,145 | -21,886 | -24,512 | -29,217 | -28,453 | -29,364 |
| 2011 | -28,987 | -26,239 | -29,108 | -28,739 | -31,085 | -30,374 | -30,250 | -31,363 | -32,325 | -31,500 | -33,109 | -32,331 |
| 2012 | -26,239 | -30,450 | -30,868 | -30,102 | -31,855 | -31,813 | -31,988 | -29,785 | -28,409 | -34,958 | -35,104 | -35,843 |
| 2013 | -32,254 | -29,108 | -32,868 | -32,166 | -32,005 | -30,742 | -33,674 | -34,102 | -34,715 | -31,334 | -32,040 | -35,448 |
| 2014 | -33,709 | -29,728 | -34,183 | -30,681 | -31,597 | -30,274 | -31,508 | -33,274 | -34,929 | -35,770 | -35,435 | -37,544 |
| 2015 | -32,326 | -27,448 | -32,630 | -30,467 | -34,051 | -34,548 | -34,875 | -36,292 | -35,028 | -37,066 | -36,879 | -38,896 |
| 2016 | -39,515 | -34,156 | -32,257 | -31,525 | -33,225 | -35,290 | -34,100 | -33,726 | -33,645 | -32,845 | -35,647 | -39,485 |
| 2017 | -34,544 | -30,587 | -35,846 | -33,971 | -35,484 | -33,343 | -32,322 | -35,434 | -39,763 | -34,362 | -36,089 | -37,979 |
| 2018 | -35,541 | -31,689 | -31,621 | -30,136 | -34,739 | -32,770 | -30,859 | -35,031 | -35,421 | -37,437 | -39,479 | -39,233 |
| 2019 | -36,620 | -32,363 | -34,372 | -32,611 | -36,118 | -33,065 | -35,518 | -34,706 | -37,065 | -34,610 | -34,811 | -35,428 |
| 2020 | -34,691 | -29,789 | -31,045 | -22,898 | -24,548 | -25,671 | -28,971 | -28,165 | -26,072 | -26,033 | -28,737 | -25,178 |
| 2021 | -27,978 | -28,150 | -34,352 | -28,474 | -31,151 | -30,250 | -34,050 | -31,368 | -24,958 | -30,273 | -33,995 | -35,085 |
| 2022 | -34,556 | -29,621 | -31,296 | -29,425 | -32,051 | -30,339 | -32,981 | -31,786 | -34,893 | -33,194 | -35,252 | -34,684 |
| 2023 | -36,377 | -32,136 | -33,937 | -31,612 | -32,350 | -30,785 | -32,183 | -33,722 | -36,078 | -35,454 | -35,695 | -36,081 |
| 2024 | -35,037 | |||||||||||
| - = No Data Reported; -- = Not Applicable; NA = Not Available; W = Withheld to avoid disclosure of individual company data. |
| Release Date: 3/29/2024 |
| Next Release Date: 4/30/2024 |