|
Download Data (XLS File) |
|
||||||||
|
||||||||
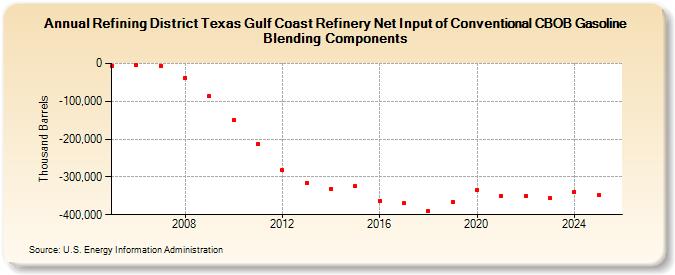
| Refining District Texas Gulf Coast Refinery Net Input of Conventional CBOB Gasoline Blending Components (Thousand Barrels) | ||||||||
| Decade | Year-0 | Year-1 | Year-2 | Year-3 | Year-4 | Year-5 | Year-6 | Year-7 | Year-8 | Year-9 |
|---|---|---|---|---|---|---|---|---|---|---|
| 2000's | -6,579 | -4,661 | -5,946 | -37,112 | -86,307 | |||||
| 2010's | -148,563 | -213,120 | -282,546 | -315,534 | -330,710 | -324,906 | -362,623 | -369,729 | -389,621 | -366,091 |
| 2020's | -334,240 | -350,712 | -349,412 | -355,806 |
| - = No Data Reported; -- = Not Applicable; NA = Not Available; W = Withheld to avoid disclosure of individual company data. |
| Release Date: 3/29/2024 |
| Next Release Date: 8/30/2024 |