|
Download Data (XLS File) |
|
||||||||
|
||||||||
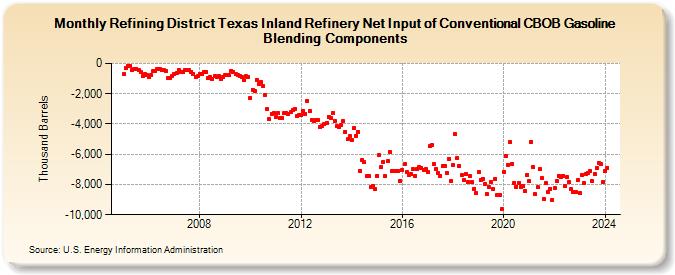
| Refining District Texas Inland Refinery Net Input of Conventional CBOB Gasoline Blending Components (Thousand Barrels) | ||||||||
| Year | Jan | Feb | Mar | Apr | May | Jun | Jul | Aug | Sep | Oct | Nov | Dec |
|---|---|---|---|---|---|---|---|---|---|---|---|---|
| 2005 | -715 | -300 | -141 | -162 | -436 | -393 | -360 | -459 | -571 | -842 | -710 | -783 |
| 2006 | -922 | -774 | -522 | -496 | -379 | -389 | -446 | -453 | -482 | -972 | -961 | -847 |
| 2007 | -692 | -620 | -435 | -560 | -551 | -419 | -410 | -463 | -543 | -688 | -908 | -855 |
| 2008 | -665 | -684 | -569 | -553 | -979 | -889 | -1,006 | -838 | -926 | -822 | -1,001 | -868 |
| 2009 | -762 | -745 | -793 | -473 | -558 | -728 | -778 | -835 | -921 | -1,077 | -845 | -905 |
| 2010 | -2,251 | -1,734 | -1,796 | -1,077 | -1,389 | -1,218 | -1,482 | -2,056 | -3,020 | -3,697 | -3,312 | -3,283 |
| 2011 | -3,557 | -3,259 | -3,601 | -3,600 | -3,294 | -3,253 | -3,330 | -3,229 | -3,073 | -3,002 | -3,461 | -3,427 |
| 2012 | -3,397 | -3,113 | -3,319 | -2,470 | -3,171 | -3,739 | -3,813 | -3,733 | -3,746 | -4,189 | -4,149 | -4,002 |
| 2013 | -3,925 | -3,516 | -3,604 | -3,249 | -3,796 | -4,142 | -4,190 | -4,095 | -3,819 | -4,528 | -5,019 | -4,828 |
| 2014 | -5,079 | -4,292 | -4,777 | -4,514 | -7,078 | -6,390 | -6,530 | -7,438 | -7,408 | -8,165 | -8,070 | -8,305 |
| 2015 | -7,423 | -6,079 | -6,877 | -6,498 | -7,452 | -6,449 | -5,827 | -7,141 | -7,078 | -7,095 | -7,127 | -7,754 |
| 2016 | -7,044 | -6,665 | -7,187 | -7,373 | -7,305 | -6,995 | -7,408 | -6,970 | -6,856 | -6,895 | -7,045 | -7,000 |
| 2017 | -7,202 | -5,485 | -5,398 | -6,673 | -6,971 | -7,265 | -7,426 | -6,762 | -6,748 | -7,212 | -6,283 | -7,785 |
| 2018 | -6,702 | -4,677 | -6,221 | -6,756 | -7,397 | -7,698 | -7,313 | -7,844 | -7,450 | -7,854 | -8,267 | -8,585 |
| 2019 | -7,195 | -7,715 | -7,609 | -7,973 | -8,643 | -8,155 | -7,821 | -8,316 | -7,606 | -8,695 | -8,718 | -9,615 |
| 2020 | -7,167 | -6,108 | -6,688 | -5,196 | -6,628 | -7,882 | -8,136 | -7,907 | -8,156 | -8,117 | -8,434 | -7,344 |
| 2021 | -7,777 | -5,171 | -6,869 | -8,653 | -8,184 | -6,982 | -7,584 | -8,944 | -7,928 | -8,467 | -8,275 | -8,996 |
| 2022 | -8,229 | -7,773 | -7,410 | -7,485 | -7,420 | -8,108 | -7,525 | -7,862 | -8,314 | -8,524 | -8,511 | -7,707 |
| 2023 | -8,557 | -7,350 | -7,919 | -7,296 | -7,241 | -7,127 | -7,800 | -7,276 | -6,890 | -6,553 | -6,659 | -7,842 |
| 2024 | -7,124 | |||||||||||
| - = No Data Reported; -- = Not Applicable; NA = Not Available; W = Withheld to avoid disclosure of individual company data. |
| Release Date: 3/29/2024 |
| Next Release Date: 4/30/2024 |