|
Download Data (XLS File) |
|
||||||||
|
||||||||
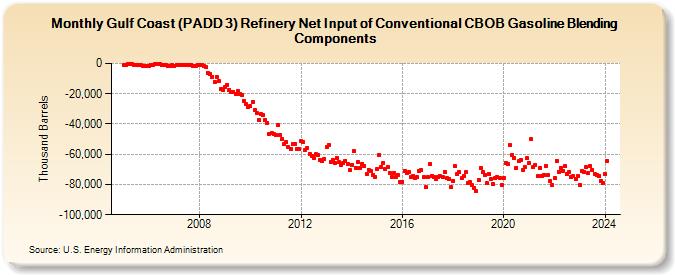
| Gulf Coast (PADD 3) Refinery Net Input of Conventional CBOB Gasoline Blending Components (Thousand Barrels) | ||||||||
| Year | Jan | Feb | Mar | Apr | May | Jun | Jul | Aug | Sep | Oct | Nov | Dec |
|---|---|---|---|---|---|---|---|---|---|---|---|---|
| 2005 | -1,154 | -871 | -482 | -570 | -598 | -969 | -1,061 | -1,174 | -998 | -1,571 | -1,541 | -1,462 |
| 2006 | -1,378 | -1,201 | -944 | -499 | -587 | -539 | -867 | -1,061 | -1,165 | -1,694 | -1,426 | -943 |
| 2007 | -1,386 | -752 | -861 | -879 | -1,128 | -961 | -921 | -989 | -1,047 | -1,463 | -1,638 | -1,065 |
| 2008 | -988 | -1,206 | -1,337 | -2,598 | -6,195 | -7,071 | -8,664 | -12,345 | -9,255 | -11,466 | -16,548 | -17,540 |
| 2009 | -15,666 | -14,039 | -17,319 | -18,790 | -18,868 | -20,035 | -18,267 | -20,153 | -20,618 | -24,688 | -27,031 | -28,654 |
| 2010 | -28,315 | -25,407 | -30,754 | -32,770 | -37,279 | -33,578 | -34,243 | -37,285 | -39,208 | -46,322 | -46,107 | -46,671 |
| 2011 | -47,391 | -40,885 | -47,234 | -50,045 | -53,460 | -51,865 | -55,240 | -56,299 | -53,100 | -52,918 | -56,546 | -56,788 |
| 2012 | -51,268 | -51,971 | -57,171 | -55,819 | -59,918 | -60,936 | -62,390 | -60,077 | -60,298 | -63,578 | -64,681 | -63,153 |
| 2013 | -55,225 | -53,614 | -65,111 | -63,825 | -65,511 | -62,246 | -65,291 | -66,863 | -66,131 | -64,201 | -66,545 | -70,435 |
| 2014 | -66,830 | -57,958 | -68,913 | -65,258 | -69,268 | -66,298 | -67,873 | -73,047 | -70,176 | -71,236 | -73,663 | -74,925 |
| 2015 | -69,451 | -60,386 | -68,232 | -65,554 | -69,667 | -68,692 | -72,173 | -74,746 | -72,563 | -75,319 | -73,797 | -78,206 |
| 2016 | -78,040 | -70,815 | -72,367 | -71,880 | -75,173 | -74,175 | -75,533 | -75,330 | -71,401 | -70,533 | -75,327 | -81,720 |
| 2017 | -75,390 | -66,474 | -74,382 | -75,006 | -76,428 | -75,373 | -74,693 | -75,105 | -71,429 | -75,990 | -76,647 | -81,911 |
| 2018 | -77,461 | -68,026 | -73,252 | -72,025 | -76,022 | -74,579 | -71,948 | -79,291 | -78,422 | -80,575 | -82,026 | -84,598 |
| 2019 | -76,906 | -68,853 | -71,945 | -73,571 | -79,279 | -73,084 | -76,651 | -80,015 | -75,998 | -75,134 | -75,543 | -80,223 |
| 2020 | -75,426 | -65,507 | -66,303 | -53,992 | -60,657 | -62,236 | -68,928 | -64,802 | -63,629 | -70,418 | -68,506 | -62,702 |
| 2021 | -65,877 | -50,261 | -68,382 | -67,078 | -74,678 | -69,007 | -74,168 | -73,548 | -67,569 | -73,796 | -77,955 | -80,099 |
| 2022 | -75,609 | -64,385 | -71,590 | -68,876 | -70,912 | -68,069 | -73,163 | -71,985 | -75,071 | -74,628 | -76,268 | -74,696 |
| 2023 | -80,429 | -71,261 | -71,557 | -68,627 | -72,691 | -67,918 | -70,562 | -72,920 | -73,650 | -74,220 | -77,542 | -78,987 |
| 2024 | -73,375 | |||||||||||
| - = No Data Reported; -- = Not Applicable; NA = Not Available; W = Withheld to avoid disclosure of individual company data. |
| Release Date: 3/29/2024 |
| Next Release Date: 4/30/2024 |