|
Download Data (XLS File) |
|
||||||||
|
||||||||
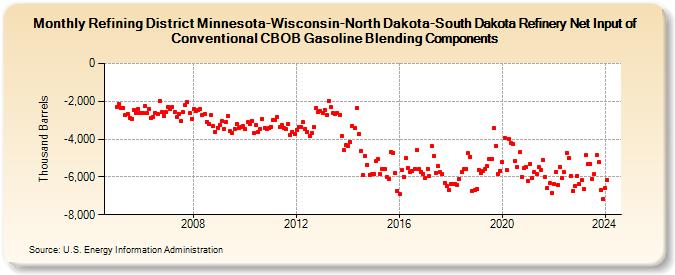
| Refining District Minnesota-Wisconsin-North Dakota-South Dakota Refinery Net Input of Conventional CBOB Gasoline Blending Components (Thousand Barrels) | ||||||||
| Year | Jan | Feb | Mar | Apr | May | Jun | Jul | Aug | Sep | Oct | Nov | Dec |
|---|---|---|---|---|---|---|---|---|---|---|---|---|
| 2005 | -2,278 | -2,132 | -2,336 | -2,346 | -2,736 | -2,651 | -2,862 | -2,919 | -2,463 | -2,596 | -2,429 | -2,618 |
| 2006 | -2,638 | -2,274 | -2,608 | -2,422 | -2,890 | -2,854 | -2,603 | -2,665 | -1,965 | -2,579 | -2,770 | -2,588 |
| 2007 | -2,293 | -2,401 | -2,315 | -2,576 | -2,841 | -2,654 | -3,055 | -2,588 | -2,217 | -2,027 | -2,635 | -2,930 |
| 2008 | -2,389 | -2,504 | -2,455 | -2,426 | -2,745 | -2,651 | -3,070 | -3,206 | -2,728 | -3,327 | -3,602 | -3,390 |
| 2009 | -3,235 | -3,069 | -3,443 | -3,101 | -2,793 | -3,596 | -3,670 | -3,460 | -3,217 | -3,419 | -3,364 | -3,331 |
| 2010 | -3,479 | -3,117 | -3,198 | -3,024 | -3,698 | -3,262 | -3,627 | -3,458 | -2,933 | -3,421 | -3,453 | -3,428 |
| 2011 | -3,347 | -2,967 | -3,008 | -2,815 | -3,375 | -3,269 | -3,412 | -3,483 | -3,175 | -3,776 | -3,606 | -3,728 |
| 2012 | -3,505 | -3,381 | -3,363 | -3,115 | -3,461 | -3,621 | -3,834 | -3,672 | -3,365 | -2,379 | -2,555 | -2,513 |
| 2013 | -2,611 | -2,443 | -2,735 | -1,980 | -2,327 | -2,613 | -2,665 | -2,621 | -2,711 | -3,823 | -4,557 | -4,321 |
| 2014 | -4,345 | -4,158 | -3,307 | -3,410 | -2,344 | -3,708 | -4,618 | -5,913 | -4,888 | -5,353 | -5,875 | -5,867 |
| 2015 | -5,852 | -5,173 | -5,070 | -5,861 | -5,602 | -5,570 | -6,003 | -6,122 | -4,686 | -4,729 | -5,803 | -6,728 |
| 2016 | -6,894 | -5,629 | -5,985 | -5,000 | -5,516 | -5,738 | -5,689 | -5,570 | -4,553 | -5,576 | -5,715 | -5,839 |
| 2017 | -6,038 | -5,562 | -5,963 | -4,356 | -4,897 | -5,782 | -5,432 | -5,762 | -5,855 | -6,300 | -6,491 | -6,669 |
| 2018 | -6,391 | -6,364 | -6,371 | -6,417 | -6,085 | -5,727 | -5,586 | -5,588 | -4,757 | -4,936 | -6,721 | -6,706 |
| 2019 | -6,626 | -5,609 | -5,803 | -5,665 | -5,569 | -5,440 | -5,034 | -5,049 | -3,416 | -4,364 | -5,852 | -5,673 |
| 2020 | -5,206 | -3,937 | -5,625 | -3,976 | -4,192 | -4,264 | -5,179 | -5,452 | -4,705 | -5,994 | -5,537 | -5,502 |
| 2021 | -6,208 | -5,292 | -6,035 | -5,741 | -5,827 | -5,495 | -5,634 | -5,102 | -5,986 | -6,574 | -6,342 | -6,866 |
| 2022 | -6,401 | -5,740 | -6,428 | -5,483 | -6,061 | -5,761 | -4,734 | -4,976 | -5,975 | -6,754 | -6,491 | -5,928 |
| 2023 | -6,392 | -6,178 | -6,648 | -4,857 | -5,321 | -5,331 | -6,099 | -5,867 | -4,844 | -5,233 | -6,718 | -7,189 |
| 2024 | -6,601 | |||||||||||
| - = No Data Reported; -- = Not Applicable; NA = Not Available; W = Withheld to avoid disclosure of individual company data. |
| Release Date: 3/29/2024 |
| Next Release Date: 4/30/2024 |