|
Download Data (XLS File) |
|
||||||||
|
||||||||
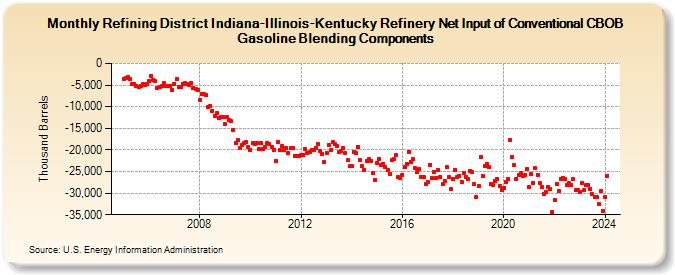
| Refining District Indiana-Illinois-Kentucky Refinery Net Input of Conventional CBOB Gasoline Blending Components (Thousand Barrels) | ||||||||
| Year | Jan | Feb | Mar | Apr | May | Jun | Jul | Aug | Sep | Oct | Nov | Dec |
|---|---|---|---|---|---|---|---|---|---|---|---|---|
| 2005 | -3,684 | -3,392 | -3,193 | -3,659 | -4,681 | -4,789 | -5,134 | -5,548 | -5,158 | -4,709 | -5,046 | -4,638 |
| 2006 | -4,133 | -2,951 | -3,740 | -4,156 | -5,764 | -5,430 | -5,300 | -4,587 | -5,266 | -5,285 | -5,262 | -6,124 |
| 2007 | -4,664 | -3,671 | -5,339 | -5,542 | -4,678 | -4,498 | -4,857 | -4,878 | -4,555 | -5,639 | -5,929 | -6,085 |
| 2008 | -8,431 | -6,992 | -7,144 | -7,311 | -10,030 | -9,727 | -10,978 | -12,221 | -11,481 | -12,550 | -12,440 | -12,387 |
| 2009 | -13,955 | -12,478 | -13,019 | -13,334 | -15,391 | -18,476 | -17,729 | -19,582 | -18,912 | -18,511 | -18,273 | -19,248 |
| 2010 | -19,983 | -18,409 | -18,745 | -18,299 | -19,893 | -18,392 | -19,714 | -19,424 | -18,301 | -18,721 | -19,343 | -20,137 |
| 2011 | -22,499 | -18,124 | -20,134 | -19,133 | -19,935 | -19,585 | -20,716 | -19,498 | -19,460 | -21,459 | -21,445 | -21,427 |
| 2012 | -21,250 | -21,217 | -19,864 | -20,726 | -20,600 | -20,023 | -20,061 | -19,513 | -18,537 | -20,351 | -20,977 | -22,870 |
| 2013 | -20,603 | -18,811 | -20,111 | -18,107 | -18,533 | -19,054 | -20,547 | -20,313 | -19,669 | -20,675 | -22,442 | -23,803 |
| 2014 | -23,732 | -20,420 | -20,774 | -19,288 | -22,255 | -23,657 | -24,667 | -22,500 | -22,114 | -22,455 | -25,328 | -26,923 |
| 2015 | -22,955 | -22,104 | -23,606 | -23,199 | -23,857 | -24,676 | -25,470 | -22,448 | -22,173 | -21,160 | -26,313 | -26,494 |
| 2016 | -25,698 | -23,878 | -23,272 | -20,387 | -22,691 | -22,201 | -24,141 | -25,106 | -24,511 | -26,228 | -26,369 | -27,851 |
| 2017 | -27,345 | -23,412 | -26,522 | -25,035 | -26,407 | -24,597 | -26,276 | -27,974 | -27,106 | -24,034 | -26,291 | -29,126 |
| 2018 | -26,804 | -24,577 | -26,304 | -25,930 | -27,375 | -25,372 | -26,210 | -26,815 | -24,941 | -25,124 | -27,905 | -30,856 |
| 2019 | -28,262 | -21,636 | -26,005 | -23,734 | -23,164 | -24,021 | -27,976 | -28,123 | -27,149 | -26,760 | -28,417 | -29,258 |
| 2020 | -28,798 | -27,359 | -26,695 | -17,610 | -21,666 | -23,557 | -26,624 | -25,864 | -25,337 | -26,121 | -25,810 | -24,420 |
| 2021 | -28,644 | -25,638 | -27,632 | -24,197 | -25,728 | -27,693 | -28,531 | -30,169 | -29,713 | -28,497 | -29,109 | -34,329 |
| 2022 | -31,504 | -27,853 | -29,427 | -26,622 | -26,399 | -26,781 | -28,038 | -27,775 | -28,180 | -26,844 | -29,275 | -29,342 |
| 2023 | -29,835 | -27,636 | -29,323 | -28,135 | -28,080 | -28,965 | -30,273 | -30,830 | -30,876 | -32,462 | -29,459 | -34,037 |
| 2024 | -30,965 | |||||||||||
| - = No Data Reported; -- = Not Applicable; NA = Not Available; W = Withheld to avoid disclosure of individual company data. |
| Release Date: 3/29/2024 |
| Next Release Date: 4/30/2024 |