|
Download Data (XLS File) |
|
||||||||
|
||||||||
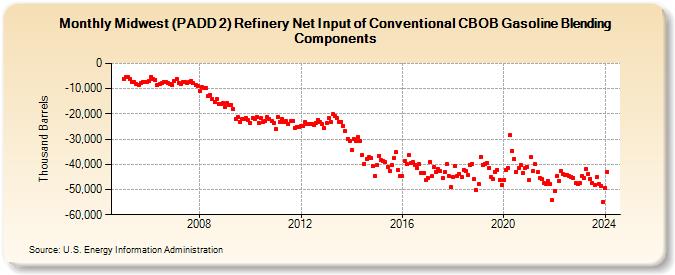
| Midwest (PADD 2) Refinery Net Input of Conventional CBOB Gasoline Blending Components (Thousand Barrels) | ||||||||
| Year | Jan | Feb | Mar | Apr | May | Jun | Jul | Aug | Sep | Oct | Nov | Dec |
|---|---|---|---|---|---|---|---|---|---|---|---|---|
| 2005 | -5,962 | -5,524 | -5,529 | -6,005 | -7,417 | -7,440 | -7,996 | -8,467 | -7,621 | -7,305 | -7,475 | -7,256 |
| 2006 | -6,771 | -5,225 | -6,348 | -6,578 | -8,654 | -8,284 | -7,903 | -7,252 | -7,231 | -7,864 | -8,032 | -8,712 |
| 2007 | -6,957 | -6,072 | -7,654 | -8,118 | -7,519 | -7,152 | -7,912 | -7,466 | -6,772 | -7,666 | -8,564 | -9,015 |
| 2008 | -10,820 | -9,496 | -9,599 | -9,737 | -12,776 | -12,378 | -14,048 | -15,427 | -14,209 | -15,877 | -16,042 | -15,777 |
| 2009 | -17,190 | -15,547 | -16,462 | -16,435 | -18,184 | -22,072 | -21,399 | -23,042 | -22,129 | -21,930 | -21,637 | -22,579 |
| 2010 | -23,532 | -21,526 | -21,943 | -21,323 | -23,591 | -21,654 | -23,341 | -22,882 | -21,234 | -22,167 | -22,853 | -23,645 |
| 2011 | -26,006 | -21,212 | -23,165 | -21,917 | -23,363 | -22,838 | -24,143 | -22,965 | -22,692 | -25,430 | -25,184 | -25,284 |
| 2012 | -24,889 | -24,679 | -23,407 | -23,971 | -24,186 | -23,820 | -24,307 | -23,443 | -22,313 | -23,380 | -24,020 | -25,682 |
| 2013 | -23,594 | -21,513 | -23,235 | -20,234 | -20,883 | -21,761 | -23,216 | -23,070 | -24,675 | -26,903 | -29,832 | -30,857 |
| 2014 | -34,302 | -30,047 | -30,942 | -29,224 | -30,607 | -36,460 | -39,842 | -37,884 | -37,207 | -37,436 | -40,839 | -44,629 |
| 2015 | -40,191 | -36,561 | -38,203 | -38,656 | -39,279 | -40,998 | -42,480 | -40,307 | -37,442 | -35,280 | -42,088 | -44,708 |
| 2016 | -44,735 | -38,733 | -40,019 | -36,414 | -39,671 | -39,089 | -40,182 | -41,601 | -40,064 | -43,600 | -43,388 | -46,411 |
| 2017 | -45,316 | -39,180 | -44,661 | -41,229 | -43,031 | -41,992 | -42,828 | -45,343 | -43,225 | -39,915 | -44,639 | -49,142 |
| 2018 | -44,955 | -40,738 | -44,480 | -43,759 | -45,073 | -42,076 | -42,767 | -44,372 | -40,205 | -39,759 | -45,984 | -50,258 |
| 2019 | -47,848 | -36,972 | -40,165 | -39,754 | -39,297 | -41,341 | -45,039 | -45,947 | -42,924 | -42,090 | -46,134 | -48,016 |
| 2020 | -46,084 | -42,129 | -41,502 | -28,529 | -34,705 | -37,985 | -42,856 | -41,522 | -40,211 | -43,484 | -41,411 | -40,882 |
| 2021 | -46,370 | -37,253 | -42,722 | -39,990 | -43,212 | -45,497 | -45,982 | -47,481 | -47,683 | -46,617 | -47,885 | -54,354 |
| 2022 | -50,643 | -44,691 | -46,436 | -42,489 | -43,988 | -44,213 | -44,240 | -44,782 | -44,851 | -45,337 | -47,554 | -47,950 |
| 2023 | -47,528 | -44,489 | -45,528 | -41,804 | -43,727 | -45,656 | -47,411 | -48,182 | -45,181 | -47,679 | -48,515 | -54,836 |
| 2024 | -49,372 | |||||||||||
| - = No Data Reported; -- = Not Applicable; NA = Not Available; W = Withheld to avoid disclosure of individual company data. |
| Release Date: 3/29/2024 |
| Next Release Date: 4/30/2024 |