|
Download Data (XLS File) |
|
||||||||
|
||||||||
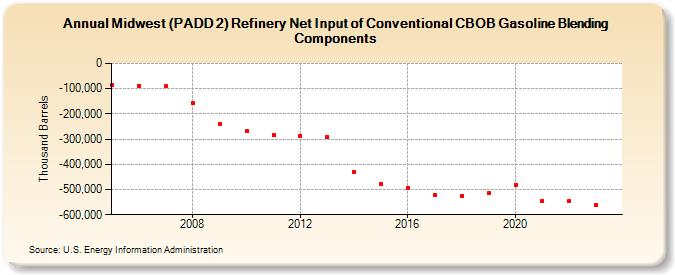
| Midwest (PADD 2) Refinery Net Input of Conventional CBOB Gasoline Blending Components (Thousand Barrels) | ||||||||
| Decade | Year-0 | Year-1 | Year-2 | Year-3 | Year-4 | Year-5 | Year-6 | Year-7 | Year-8 | Year-9 |
|---|---|---|---|---|---|---|---|---|---|---|
| 2000's | -83,997 | -88,854 | -90,867 | -156,186 | -238,606 | |||||
| 2010's | -269,691 | -284,199 | -288,097 | -289,773 | -429,419 | -476,193 | -493,907 | -520,501 | -524,426 | -515,527 |
| 2020's | -481,300 | -545,046 | -547,174 | -560,536 |
| - = No Data Reported; -- = Not Applicable; NA = Not Available; W = Withheld to avoid disclosure of individual company data. |
| Release Date: 3/29/2024 |
| Next Release Date: 8/30/2024 |