|
Download Data (XLS File) |
|
||||||||
|
||||||||
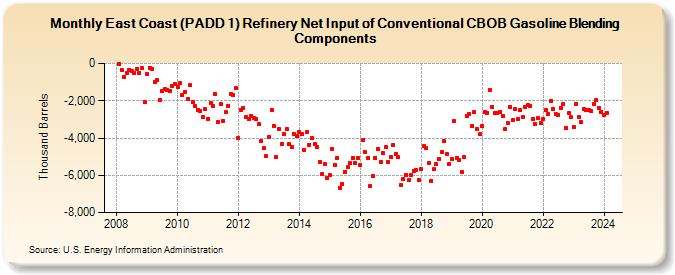
| East Coast (PADD 1) Refinery Net Input of Conventional CBOB Gasoline Blending Components (Thousand Barrels) | ||||||||
| Year | Jan | Feb | Mar | Apr | May | Jun | Jul | Aug | Sep | Oct | Nov | Dec |
|---|---|---|---|---|---|---|---|---|---|---|---|---|
| 2008 | -54 | -324 | -725 | -508 | -323 | -402 | -510 | -297 | -487 | -263 | -2,082 | |
| 2009 | -584 | -224 | -287 | -988 | -890 | -1,941 | -1,491 | -1,377 | -1,403 | -1,470 | -1,209 | -1,117 |
| 2010 | -1,247 | -1,073 | -1,681 | -1,512 | -1,888 | -1,178 | -2,076 | -2,263 | -2,491 | -2,560 | -2,849 | -2,462 |
| 2011 | -2,960 | -2,109 | -2,263 | -1,654 | -3,144 | -2,196 | -3,095 | -2,624 | -2,257 | -1,635 | -1,687 | -1,311 |
| 2012 | -4,004 | -2,494 | -2,385 | -2,883 | -2,987 | -2,838 | -2,934 | -2,996 | -3,248 | -4,186 | -4,539 | -4,982 |
| 2013 | -3,946 | -2,493 | -3,353 | -5,040 | -3,532 | -4,313 | -3,775 | -3,513 | -4,337 | -4,457 | -3,809 | -3,910 |
| 2014 | -3,666 | -3,787 | -4,620 | -3,680 | -4,361 | -4,021 | -4,340 | -4,473 | -5,264 | -5,926 | -5,378 | -6,145 |
| 2015 | -6,000 | -4,593 | -5,458 | -5,053 | -6,660 | -6,442 | -5,799 | -5,561 | -5,366 | -5,048 | -5,320 | -5,076 |
| 2016 | -5,460 | -4,118 | -4,761 | -5,090 | -6,580 | -6,044 | -5,058 | -4,567 | -5,301 | -4,815 | -4,494 | -5,269 |
| 2017 | -5,007 | -4,365 | -4,874 | -5,044 | -6,547 | -6,221 | -5,962 | -6,258 | -6,007 | -5,775 | -5,735 | -6,257 |
| 2018 | -5,665 | -4,443 | -4,553 | -5,328 | -6,292 | -5,688 | -5,406 | -5,109 | -4,771 | -4,183 | -4,877 | -5,381 |
| 2019 | -5,117 | -3,091 | -5,055 | -5,199 | -5,812 | -5,033 | -2,793 | -2,711 | -3,337 | -2,611 | -3,523 | -3,807 |
| 2020 | -3,371 | -2,586 | -2,635 | -1,419 | -2,324 | -2,681 | -2,651 | -2,609 | -2,824 | -3,542 | -3,220 | -2,310 |
| 2021 | -3,031 | -2,468 | -2,969 | -2,505 | -2,885 | -2,309 | -2,237 | -2,263 | -2,966 | -3,269 | -2,933 | -3,197 |
| 2022 | -2,986 | -2,523 | -2,693 | -2,022 | -2,445 | -2,703 | -2,767 | -2,368 | -2,198 | -3,437 | -2,683 | -2,887 |
| 2023 | -3,394 | -2,162 | -2,892 | -3,143 | -2,460 | -2,479 | -2,519 | -2,570 | -2,164 | -1,969 | -2,401 | -2,585 |
| 2024 | -2,774 | |||||||||||
| - = No Data Reported; -- = Not Applicable; NA = Not Available; W = Withheld to avoid disclosure of individual company data. |
| Release Date: 3/29/2024 |
| Next Release Date: 4/30/2024 |