|
Download Data (XLS File) |
|
||||||||
|
||||||||
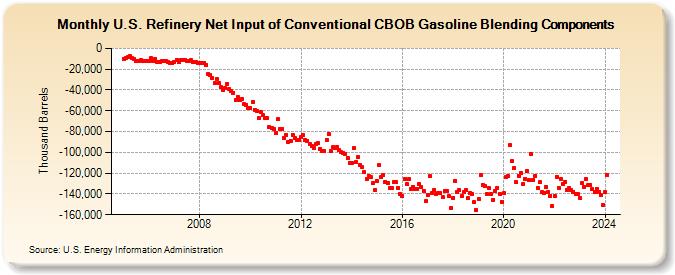
| U.S. Refinery Net Input of Conventional CBOB Gasoline Blending Components (Thousand Barrels) | ||||||||
| Year | Jan | Feb | Mar | Apr | May | Jun | Jul | Aug | Sep | Oct | Nov | Dec |
|---|---|---|---|---|---|---|---|---|---|---|---|---|
| 2005 | -9,746 | -8,802 | -8,094 | -7,790 | -9,442 | -10,319 | -12,050 | -12,392 | -11,238 | -12,351 | -12,531 | -12,241 |
| 2006 | -11,857 | -9,684 | -11,815 | -10,180 | -13,249 | -12,707 | -12,371 | -11,958 | -11,753 | -13,295 | -13,934 | -14,291 |
| 2007 | -13,109 | -10,790 | -12,918 | -11,579 | -11,603 | -11,307 | -12,535 | -12,099 | -11,511 | -13,386 | -13,164 | -13,879 |
| 2008 | -14,467 | -14,120 | -14,169 | -15,517 | -24,321 | -25,460 | -28,096 | -33,699 | -29,092 | -33,062 | -37,607 | -40,100 |
| 2009 | -38,001 | -33,923 | -38,951 | -40,680 | -42,591 | -49,169 | -46,702 | -49,606 | -48,748 | -53,297 | -54,169 | -57,315 |
| 2010 | -57,685 | -52,029 | -58,880 | -60,282 | -67,406 | -61,555 | -64,368 | -67,337 | -67,054 | -75,607 | -76,700 | -77,734 |
| 2011 | -81,036 | -68,243 | -77,313 | -77,630 | -85,725 | -82,974 | -89,706 | -88,618 | -83,063 | -85,998 | -88,104 | -88,238 |
| 2012 | -84,914 | -83,531 | -88,341 | -89,005 | -92,441 | -93,921 | -95,857 | -92,366 | -91,287 | -96,657 | -98,674 | -99,116 |
| 2013 | -87,672 | -82,026 | -98,714 | -95,168 | -95,624 | -94,409 | -97,859 | -99,687 | -100,335 | -101,322 | -105,376 | -109,886 |
| 2014 | -110,001 | -96,016 | -109,216 | -104,303 | -112,192 | -114,454 | -119,156 | -125,415 | -122,443 | -124,083 | -129,690 | -136,205 |
| 2015 | -127,762 | -112,475 | -123,923 | -121,752 | -128,190 | -129,795 | -134,644 | -134,691 | -128,748 | -128,566 | -134,152 | -140,445 |
| 2016 | -142,137 | -125,414 | -130,933 | -126,011 | -135,601 | -132,985 | -135,626 | -135,320 | -130,736 | -133,170 | -136,915 | -147,057 |
| 2017 | -140,592 | -123,040 | -138,966 | -136,188 | -139,839 | -138,933 | -139,285 | -143,036 | -136,822 | -137,285 | -142,025 | -153,517 |
| 2018 | -143,814 | -127,509 | -137,968 | -136,390 | -142,336 | -138,287 | -136,609 | -144,357 | -139,026 | -140,034 | -148,091 | -155,759 |
| 2019 | -144,999 | -121,478 | -131,106 | -132,665 | -140,479 | -134,528 | -139,898 | -145,556 | -136,719 | -134,197 | -140,193 | -147,340 |
| 2020 | -139,404 | -123,659 | -122,781 | -93,341 | -108,664 | -115,051 | -128,898 | -122,404 | -119,842 | -130,225 | -125,289 | -118,158 |
| 2021 | -127,024 | -101,444 | -126,745 | -122,344 | -134,035 | -128,992 | -138,062 | -138,816 | -132,952 | -138,345 | -141,664 | -151,716 |
| 2022 | -142,209 | -123,380 | -134,251 | -125,400 | -130,230 | -128,482 | -135,745 | -134,099 | -135,787 | -137,674 | -140,206 | -139,922 |
| 2023 | -143,842 | -129,711 | -132,931 | -125,705 | -131,766 | -131,166 | -135,567 | -138,450 | -134,846 | -137,806 | -141,329 | -150,278 |
| 2024 | -138,544 | |||||||||||
| - = No Data Reported; -- = Not Applicable; NA = Not Available; W = Withheld to avoid disclosure of individual company data. |
| Release Date: 3/29/2024 |
| Next Release Date: 4/30/2024 |