|
Download Data (XLS File) |
|
||||||||
|
||||||||
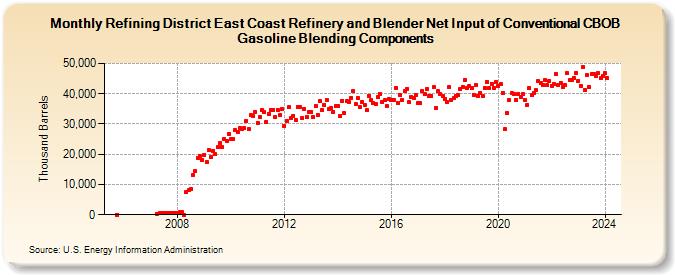
| Refining District East Coast Refinery and Blender Net Input of Conventional CBOB Gasoline Blending Components (Thousand Barrels) | ||||||||
| Year | Jan | Feb | Mar | Apr | May | Jun | Jul | Aug | Sep | Oct | Nov | Dec |
|---|---|---|---|---|---|---|---|---|---|---|---|---|
| 2005 | 68 | |||||||||||
| 2007 | 395 | 480 | 462 | 475 | 499 | 458 | 485 | 445 | 451 | |||
| 2008 | 440 | 859 | 813 | 7 | 7,380 | 8,160 | 8,537 | 13,096 | 14,387 | 18,758 | 19,348 | 18,220 |
| 2009 | 19,830 | 17,422 | 21,321 | 19,106 | 21,124 | 19,932 | 22,395 | 23,616 | 22,354 | 24,960 | 24,472 | 26,828 |
| 2010 | 25,093 | 25,093 | 27,881 | 27,494 | 28,510 | 28,428 | 28,566 | 31,061 | 28,276 | 32,804 | 32,482 | 34,002 |
| 2011 | 30,361 | 32,233 | 34,470 | 33,813 | 30,765 | 33,368 | 34,675 | 34,782 | 32,176 | 34,687 | 32,850 | 34,981 |
| 2012 | 29,259 | 30,855 | 35,491 | 31,935 | 32,766 | 31,330 | 35,667 | 35,479 | 32,021 | 34,877 | 32,429 | 34,090 |
| 2013 | 34,062 | 32,162 | 35,997 | 33,033 | 37,458 | 34,679 | 36,394 | 37,956 | 34,866 | 35,363 | 33,967 | 35,923 |
| 2014 | 35,890 | 32,718 | 37,701 | 33,626 | 37,581 | 37,109 | 38,723 | 40,830 | 36,469 | 38,580 | 35,517 | 37,287 |
| 2015 | 36,126 | 34,468 | 39,319 | 37,830 | 36,813 | 36,551 | 38,878 | 39,897 | 37,171 | 37,768 | 35,825 | 38,418 |
| 2016 | 38,074 | 37,791 | 41,971 | 37,099 | 39,419 | 37,861 | 40,939 | 41,656 | 37,176 | 38,907 | 38,707 | 39,649 |
| 2017 | 36,822 | 36,880 | 40,835 | 39,873 | 41,442 | 39,328 | 39,267 | 42,076 | 35,168 | 40,790 | 39,991 | 39,399 |
| 2018 | 38,106 | 37,230 | 42,216 | 37,863 | 38,436 | 39,394 | 39,618 | 41,453 | 42,303 | 44,656 | 41,924 | 42,446 |
| 2019 | 41,948 | 39,657 | 42,826 | 39,359 | 40,173 | 39,216 | 41,919 | 44,038 | 41,795 | 43,346 | 41,910 | 43,761 |
| 2020 | 42,416 | 43,249 | 40,333 | 28,209 | 33,534 | 38,028 | 40,163 | 39,794 | 38,062 | 39,982 | 38,801 | 39,760 |
| 2021 | 38,040 | 36,289 | 41,830 | 39,522 | 40,293 | 41,220 | 44,132 | 43,461 | 42,755 | 44,411 | 42,821 | 44,313 |
| 2022 | 42,688 | 43,248 | 46,467 | 42,954 | 43,678 | 42,225 | 42,735 | 46,689 | 44,453 | 44,548 | 45,317 | 46,937 |
| 2023 | 44,257 | 42,712 | 48,849 | 41,301 | 46,033 | 42,204 | 46,474 | 46,601 | 45,875 | 46,789 | 45,251 | 46,014 |
| 2024 | 46,717 | |||||||||||
| - = No Data Reported; -- = Not Applicable; NA = Not Available; W = Withheld to avoid disclosure of individual company data. |
| Release Date: 3/29/2024 |
| Next Release Date: 4/30/2024 |