|
Download Data (XLS File) |
|
||||||||
|
||||||||
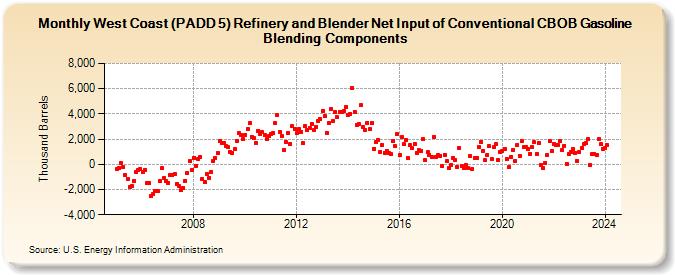
| West Coast (PADD 5) Refinery and Blender Net Input of Conventional CBOB Gasoline Blending Components (Thousand Barrels) | ||||||||
| Year | Jan | Feb | Mar | Apr | May | Jun | Jul | Aug | Sep | Oct | Nov | Dec |
|---|---|---|---|---|---|---|---|---|---|---|---|---|
| 2005 | -384 | -263 | 134 | -187 | -851 | -1,131 | -1,797 | -1,702 | -1,286 | -611 | -421 | -386 |
| 2006 | -594 | -431 | -1,459 | -1,515 | -2,553 | -2,372 | -2,134 | -2,154 | -1,327 | -322 | -1,068 | -1,355 |
| 2007 | -1,449 | -831 | -883 | -744 | -1,546 | -1,739 | -2,052 | -1,843 | -1,316 | -710 | 262 | -426 |
| 2008 | 536 | -96 | 450 | 605 | -1,177 | -1,427 | -766 | -1,051 | -609 | 266 | 504 | 882 |
| 2009 | 1,811 | 1,665 | 1,719 | 1,468 | 1,336 | 993 | 891 | 1,196 | 1,831 | 2,479 | 2,364 | 1,986 |
| 2010 | 2,346 | 2,813 | 3,240 | 2,203 | 2,052 | 1,706 | 2,652 | 2,443 | 2,532 | 2,305 | 1,997 | 2,263 |
| 2011 | 2,412 | 2,463 | 3,252 | 3,921 | 2,590 | 2,251 | 1,166 | 1,772 | 2,486 | 1,636 | 3,003 | 2,768 |
| 2012 | 2,456 | 2,765 | 2,600 | 1,671 | 3,016 | 2,701 | 2,881 | 3,226 | 2,703 | 2,970 | 3,456 | 3,564 |
| 2013 | 4,255 | 3,839 | 2,519 | 3,297 | 4,355 | 3,442 | 4,151 | 3,717 | 4,144 | 4,189 | 4,243 | 4,551 |
| 2014 | 3,917 | 4,013 | 6,030 | 4,186 | 3,124 | 3,193 | 4,671 | 2,998 | 2,714 | 3,304 | 2,769 | 3,240 |
| 2015 | 1,235 | 1,734 | 1,963 | 996 | 1,549 | 927 | 1,082 | 861 | 792 | 1,858 | 1,426 | 2,400 |
| 2016 | 728 | 2,172 | 1,602 | 1,959 | 504 | 1,531 | 1,275 | 1,592 | 930 | 1,122 | 1,093 | 1,977 |
| 2017 | 314 | 937 | 760 | 585 | 2,187 | 607 | 756 | 682 | -132 | 762 | 229 | -300 |
| 2018 | -64 | 526 | 346 | -178 | 1,311 | -101 | -275 | -55 | -300 | 630 | -370 | 537 |
| 2019 | 527 | 1,390 | 1,804 | 1,094 | 312 | 750 | 1,419 | 403 | 1,360 | 1,580 | 354 | 998 |
| 2020 | 1,069 | 1,248 | 416 | -238 | 611 | 1,123 | 265 | 1,518 | 697 | 1,819 | 1,390 | 1,356 |
| 2021 | 1,202 | 843 | 1,344 | 1,747 | 820 | 1,710 | -32 | -324 | 112 | 749 | 1,835 | 1,052 |
| 2022 | 1,639 | 1,502 | 1,548 | 1,837 | 1,117 | 1,474 | 44 | 801 | 1,006 | 1,223 | 922 | 256 |
| 2023 | 963 | 1,329 | 1,572 | 1,705 | 1,978 | -62 | 814 | 821 | 738 | 1,988 | 1,587 | 1,216 |
| 2024 | 1,296 | |||||||||||
| - = No Data Reported; -- = Not Applicable; NA = Not Available; W = Withheld to avoid disclosure of individual company data. |
| Release Date: 3/29/2024 |
| Next Release Date: 4/30/2024 |