|
Download Data (XLS File) |
|
||||||||
|
||||||||
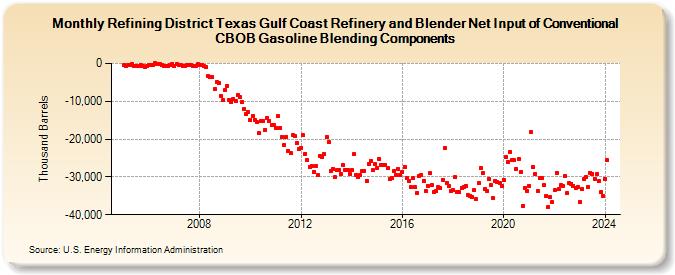
| Refining District Texas Gulf Coast Refinery and Blender Net Input of Conventional CBOB Gasoline Blending Components (Thousand Barrels) | ||||||||
| Year | Jan | Feb | Mar | Apr | May | Jun | Jul | Aug | Sep | Oct | Nov | Dec |
|---|---|---|---|---|---|---|---|---|---|---|---|---|
| 2005 | -439 | -571 | -341 | -408 | -162 | -576 | -701 | -715 | -427 | -729 | -831 | -679 |
| 2006 | -456 | -427 | -422 | -3 | -208 | -150 | -421 | -608 | -683 | -722 | -465 | -96 |
| 2007 | -694 | -132 | -426 | -319 | -577 | -542 | -511 | -526 | -504 | -775 | -730 | -210 |
| 2008 | -323 | -522 | -768 | -1,001 | -3,323 | -3,652 | -3,655 | -6,798 | -4,896 | -5,088 | -8,567 | -9,719 |
| 2009 | -7,077 | -5,876 | -9,681 | -10,253 | -9,348 | -9,981 | -8,323 | -8,822 | -10,136 | -11,944 | -13,407 | -12,960 |
| 2010 | -14,876 | -13,804 | -14,828 | -15,504 | -18,454 | -15,163 | -15,147 | -17,479 | -14,359 | -15,228 | -16,282 | -16,267 |
| 2011 | -16,976 | -13,999 | -16,971 | -19,328 | -21,574 | -19,317 | -23,149 | -23,641 | -19,028 | -19,190 | -21,121 | -22,666 |
| 2012 | -22,398 | -18,995 | -23,834 | -25,468 | -27,301 | -27,025 | -28,683 | -27,158 | -29,613 | -24,345 | -24,847 | -24,004 |
| 2013 | -19,473 | -20,816 | -28,561 | -27,815 | -30,154 | -28,189 | -28,122 | -29,160 | -26,946 | -28,246 | -28,180 | -29,287 |
| 2014 | -28,232 | -24,021 | -29,553 | -30,043 | -29,596 | -28,329 | -28,423 | -31,044 | -26,639 | -25,683 | -28,299 | -26,601 |
| 2015 | -27,541 | -25,327 | -26,867 | -26,874 | -26,829 | -27,725 | -30,614 | -30,225 | -28,318 | -29,547 | -27,931 | -29,373 |
| 2016 | -28,684 | -27,270 | -30,283 | -30,980 | -32,632 | -30,416 | -32,747 | -34,234 | -29,733 | -29,494 | -31,023 | -33,717 |
| 2017 | -32,381 | -29,056 | -32,218 | -33,928 | -33,704 | -32,772 | -33,059 | -30,724 | -22,301 | -31,665 | -32,521 | -33,722 |
| 2018 | -33,465 | -30,092 | -34,052 | -34,037 | -32,833 | -32,612 | -32,280 | -34,891 | -34,974 | -35,319 | -33,497 | -35,945 |
| 2019 | -31,704 | -27,608 | -28,942 | -33,233 | -33,714 | -30,472 | -32,272 | -35,490 | -30,965 | -31,383 | -31,608 | -32,342 |
| 2020 | -30,724 | -24,670 | -26,011 | -23,395 | -25,416 | -25,637 | -27,860 | -25,190 | -28,782 | -37,568 | -32,817 | -33,688 |
| 2021 | -32,324 | -18,231 | -27,433 | -29,110 | -33,717 | -30,286 | -30,380 | -32,208 | -35,047 | -37,831 | -35,373 | -36,670 |
| 2022 | -33,468 | -28,869 | -33,249 | -32,245 | -32,397 | -29,861 | -34,367 | -31,696 | -31,770 | -32,320 | -32,929 | -32,788 |
| 2023 | -36,702 | -33,328 | -30,610 | -30,026 | -32,564 | -28,872 | -29,198 | -30,482 | -29,290 | -31,113 | -34,061 | -34,992 |
| 2024 | -30,539 | |||||||||||
| - = No Data Reported; -- = Not Applicable; NA = Not Available; W = Withheld to avoid disclosure of individual company data. |
| Release Date: 3/29/2024 |
| Next Release Date: 4/30/2024 |