|
Download Data (XLS File) |
|
||||||||
|
||||||||
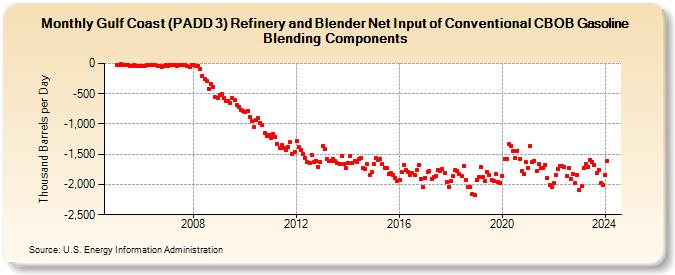
| Gulf Coast (PADD 3) Refinery and Blender Net Input of Conventional CBOB Gasoline Blending Components (Thousand Barrels per Day) | ||||||||
| Year | Jan | Feb | Mar | Apr | May | Jun | Jul | Aug | Sep | Oct | Nov | Dec |
|---|---|---|---|---|---|---|---|---|---|---|---|---|
| 2005 | -31 | -25 | -11 | -19 | -18 | -32 | -34 | -37 | -30 | -47 | -46 | -44 |
| 2006 | -40 | -40 | -27 | -17 | -19 | -18 | -28 | -34 | -37 | -50 | -43 | -26 |
| 2007 | -40 | -22 | -23 | -29 | -36 | -32 | -30 | -32 | -33 | -43 | -51 | -31 |
| 2008 | -31 | -41 | -39 | -84 | -209 | -261 | -295 | -416 | -336 | -393 | -559 | -567 |
| 2009 | -517 | -505 | -564 | -626 | -623 | -653 | -572 | -607 | -683 | -714 | -768 | -791 |
| 2010 | -800 | -781 | -886 | -951 | -1,056 | -934 | -897 | -980 | -1,015 | -1,156 | -1,202 | -1,179 |
| 2011 | -1,225 | -1,162 | -1,209 | -1,331 | -1,405 | -1,347 | -1,403 | -1,433 | -1,382 | -1,296 | -1,490 | -1,465 |
| 2012 | -1,276 | -1,386 | -1,428 | -1,497 | -1,562 | -1,635 | -1,639 | -1,505 | -1,635 | -1,604 | -1,703 | -1,633 |
| 2013 | -1,356 | -1,418 | -1,587 | -1,607 | -1,609 | -1,575 | -1,614 | -1,646 | -1,654 | -1,523 | -1,665 | -1,736 |
| 2014 | -1,641 | -1,525 | -1,648 | -1,610 | -1,628 | -1,579 | -1,562 | -1,735 | -1,744 | -1,666 | -1,841 | -1,794 |
| 2015 | -1,664 | -1,565 | -1,589 | -1,587 | -1,662 | -1,727 | -1,734 | -1,823 | -1,803 | -1,836 | -1,897 | -1,944 |
| 2016 | -1,920 | -1,801 | -1,682 | -1,763 | -1,796 | -1,850 | -1,810 | -1,843 | -1,764 | -1,678 | -1,903 | -2,048 |
| 2017 | -1,888 | -1,789 | -1,776 | -1,903 | -1,881 | -1,858 | -1,767 | -1,770 | -1,743 | -1,808 | -1,955 | -2,034 |
| 2018 | -1,942 | -1,865 | -1,755 | -1,783 | -1,828 | -1,866 | -1,701 | -1,931 | -2,040 | -2,039 | -2,157 | -2,179 |
| 2019 | -1,929 | -1,875 | -1,713 | -1,875 | -1,950 | -1,788 | -1,851 | -1,924 | -1,946 | -1,825 | -1,967 | -1,969 |
| 2020 | -1,856 | -1,572 | -1,574 | -1,335 | -1,357 | -1,445 | -1,567 | -1,439 | -1,579 | -1,779 | -1,822 | -1,635 |
| 2021 | -1,721 | -1,370 | -1,634 | -1,605 | -1,784 | -1,663 | -1,735 | -1,735 | -1,680 | -1,896 | -2,001 | -2,049 |
| 2022 | -1,979 | -1,841 | -1,746 | -1,700 | -1,693 | -1,713 | -1,860 | -1,725 | -1,917 | -1,820 | -1,981 | -1,849 |
| 2023 | -2,088 | -2,030 | -1,723 | -1,661 | -1,705 | -1,588 | -1,622 | -1,680 | -1,813 | -1,769 | -1,981 | -2,005 |
| 2024 | -1,836 | |||||||||||
| - = No Data Reported; -- = Not Applicable; NA = Not Available; W = Withheld to avoid disclosure of individual company data. |
| Release Date: 3/29/2024 |
| Next Release Date: 4/30/2024 |