|
Download Data (XLS File) |
|
||||||||
|
||||||||
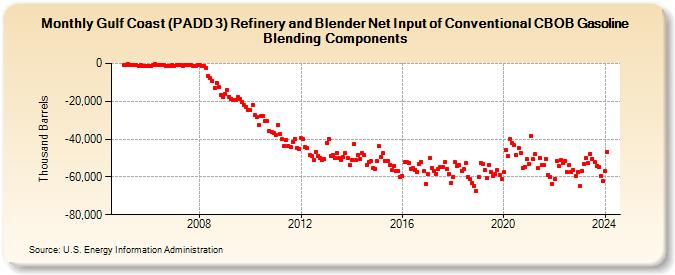
| Gulf Coast (PADD 3) Refinery and Blender Net Input of Conventional CBOB Gasoline Blending Components (Thousand Barrels) | ||||||||
| Year | Jan | Feb | Mar | Apr | May | Jun | Jul | Aug | Sep | Oct | Nov | Dec |
|---|---|---|---|---|---|---|---|---|---|---|---|---|
| 2005 | -974 | -704 | -334 | -561 | -569 | -953 | -1,054 | -1,157 | -913 | -1,448 | -1,366 | -1,360 |
| 2006 | -1,242 | -1,112 | -825 | -499 | -587 | -539 | -867 | -1,061 | -1,109 | -1,545 | -1,280 | -794 |
| 2007 | -1,243 | -613 | -728 | -879 | -1,128 | -961 | -921 | -989 | -980 | -1,348 | -1,519 | -961 |
| 2008 | -948 | -1,186 | -1,207 | -2,519 | -6,472 | -7,835 | -9,156 | -12,901 | -10,091 | -12,193 | -16,780 | -17,562 |
| 2009 | -16,031 | -14,145 | -17,492 | -18,768 | -19,312 | -19,578 | -17,723 | -18,811 | -20,490 | -22,126 | -23,031 | -24,513 |
| 2010 | -24,805 | -21,854 | -27,469 | -28,533 | -32,743 | -28,029 | -27,808 | -30,392 | -30,442 | -35,849 | -36,058 | -36,544 |
| 2011 | -37,976 | -32,537 | -37,469 | -39,916 | -43,562 | -40,403 | -43,484 | -44,430 | -41,474 | -40,188 | -44,710 | -45,409 |
| 2012 | -39,554 | -40,189 | -44,261 | -44,914 | -48,430 | -49,062 | -50,794 | -46,669 | -49,057 | -49,736 | -51,089 | -50,610 |
| 2013 | -42,046 | -39,694 | -49,196 | -48,204 | -49,891 | -47,264 | -50,028 | -51,015 | -49,634 | -47,198 | -49,962 | -53,827 |
| 2014 | -50,858 | -42,711 | -51,092 | -48,302 | -50,476 | -47,368 | -48,431 | -53,781 | -52,305 | -51,635 | -55,220 | -55,615 |
| 2015 | -51,593 | -43,821 | -49,251 | -47,603 | -51,507 | -51,813 | -53,740 | -56,524 | -54,081 | -56,931 | -56,918 | -60,258 |
| 2016 | -59,529 | -52,228 | -52,148 | -52,901 | -55,671 | -55,507 | -56,122 | -57,142 | -52,923 | -52,023 | -57,086 | -63,493 |
| 2017 | -58,518 | -50,080 | -55,066 | -57,103 | -58,296 | -55,752 | -54,792 | -54,857 | -52,295 | -56,063 | -58,660 | -63,042 |
| 2018 | -60,201 | -52,208 | -54,390 | -53,496 | -56,672 | -55,994 | -52,746 | -59,846 | -61,195 | -63,208 | -64,722 | -67,549 |
| 2019 | -59,791 | -52,487 | -53,114 | -56,241 | -60,451 | -53,625 | -57,366 | -59,634 | -58,370 | -56,585 | -59,009 | -61,038 |
| 2020 | -57,539 | -45,584 | -48,792 | -40,053 | -42,080 | -43,353 | -48,571 | -44,603 | -47,365 | -55,143 | -54,666 | -50,676 |
| 2021 | -53,360 | -38,346 | -50,664 | -48,139 | -55,317 | -49,904 | -53,788 | -53,794 | -50,386 | -58,769 | -60,029 | -63,521 |
| 2022 | -61,356 | -51,557 | -54,114 | -51,000 | -52,491 | -51,391 | -57,657 | -53,461 | -57,512 | -56,408 | -59,420 | -57,321 |
| 2023 | -64,682 | -56,741 | -53,417 | -49,846 | -52,804 | -47,769 | -50,278 | -52,114 | -54,379 | -54,792 | -59,439 | -62,067 |
| 2024 | -56,928 | -46,581 | -53,965 | -45,958 | -50,082 | -46,540 | ||||||
| - = No Data Reported; -- = Not Applicable; NA = Not Available; W = Withheld to avoid disclosure of individual company data. |
| Release Date: 8/30/2024 |
| Next Release Date: 9/30/2024 |